KChart::AbstractDiagram
#include <KChartAbstractDiagram.h>
Signals | |
| void | aboutToBeDestroyed () |
| void | attributesModelAboutToChange (KChart::AttributesModel *newModel, KChart::AttributesModel *oldModel) |
| void | boundariesChanged () |
| void | dataHidden () |
| void | layoutChanged (KChart::AbstractDiagram *) |
| void | modelDataChanged () |
| void | modelsChanged () |
| void | propertiesChanged () |
| void | viewportCoordinateSystemChanged () |
Public Member Functions | |
| bool | allowOverlappingDataValueTexts () const |
| bool | antiAliasing () const |
| virtual AttributesModel * | attributesModel () const |
| QBrush | brush () const |
| QBrush | brush (const QModelIndex &index) const |
| QBrush | brush (int dataset) const |
| bool | compare (const AbstractDiagram *other) const |
| AbstractCoordinatePlane * | coordinatePlane () const |
| const QPair< QPointF, QPointF > | dataBoundaries () const |
| void | dataChanged (const QModelIndex &topLeft, const QModelIndex &bottomRight, const QVector< int > &roles=QVector< int >()) override |
| QList< QBrush > | datasetBrushes () const |
| int | datasetDimension () const |
| QStringList | datasetLabels () const |
| QList< MarkerAttributes > | datasetMarkers () const |
| QList< QPen > | datasetPens () const |
| DataValueAttributes | dataValueAttributes () const |
| DataValueAttributes | dataValueAttributes (const QModelIndex &index) const |
| DataValueAttributes | dataValueAttributes (int dataset) const |
| void | doItemsLayout () override |
| int | horizontalOffset () const override |
| QModelIndex | indexAt (const QPoint &point) const override |
| QModelIndexList | indexesAt (const QPoint &point) const |
| QModelIndexList | indexesIn (const QRect &rect) const |
| bool | isHidden () const |
| bool | isHidden (const QModelIndex &index) const |
| bool | isHidden (int dataset) const |
| bool | isIndexHidden (const QModelIndex &index) const override |
| QStringList | itemRowLabels () const |
| QModelIndex | moveCursor (CursorAction cursorAction, Qt::KeyboardModifiers modifiers) override |
| virtual void | paint (PaintContext *paintContext)=0 |
| void | paintDataValueText (QPainter *painter, const QModelIndex &index, const QPointF &pos, qreal value) |
| void | paintMarker (QPainter *painter, const DataValueAttributes &a, const QModelIndex &index, const QPointF &pos) |
| virtual void | paintMarker (QPainter *painter, const MarkerAttributes &markerAttributes, const QBrush &brush, const QPen &, const QPointF &point, const QSizeF &size) |
| void | paintMarker (QPainter *painter, const QModelIndex &index, const QPointF &pos) |
| QPen | pen () const |
| QPen | pen (const QModelIndex &index) const |
| QPen | pen (int dataset) const |
| bool | percentMode () const |
| virtual void | resize (const QSizeF &area) |
| void | scrollTo (const QModelIndex &index, ScrollHint hint=EnsureVisible) override |
| void | setAllowOverlappingDataValueTexts (bool allow) |
| void | setAntiAliasing (bool enabled) |
| virtual void | setAttributesModel (AttributesModel *model) |
| void | setBrush (const QBrush &brush) |
| void | setBrush (const QModelIndex &index, const QBrush &brush) |
| void | setBrush (int dataset, const QBrush &brush) |
| virtual void | setCoordinatePlane (AbstractCoordinatePlane *plane) |
| void | setDatasetDimension (int dimension) |
| void | setDataValueAttributes (const DataValueAttributes &a) |
| void | setDataValueAttributes (const QModelIndex &index, const DataValueAttributes &a) |
| void | setDataValueAttributes (int dataset, const DataValueAttributes &a) |
| void | setHidden (bool hidden) |
| void | setHidden (const QModelIndex &index, bool hidden) |
| void | setHidden (int dataset, bool hidden) |
| void | setModel (QAbstractItemModel *model) override |
| void | setPen (const QModelIndex &index, const QPen &pen) |
| void | setPen (const QPen &pen) |
| void | setPen (int dataset, const QPen &pen) |
| void | setPercentMode (bool percent) |
| void | setRootIndex (const QModelIndex &idx) override |
| void | setSelection (const QRect &rect, QItemSelectionModel::SelectionFlags command) override |
| void | setSelectionModel (QItemSelectionModel *selectionModel) override |
| void | setUnitPrefix (const QString &prefix, int column, Qt::Orientation orientation) |
| void | setUnitPrefix (const QString &prefix, Qt::Orientation orientation) |
| void | setUnitSuffix (const QString &suffix, int column, Qt::Orientation orientation) |
| void | setUnitSuffix (const QString &suffix, Qt::Orientation orientation) |
| QString | unitPrefix (int column, Qt::Orientation orientation, bool fallback=false) const |
| QString | unitPrefix (Qt::Orientation orientation) const |
| QString | unitSuffix (int column, Qt::Orientation orientation, bool fallback=false) const |
| QString | unitSuffix (Qt::Orientation orientation) const |
| void | update () const |
| void | useDefaultColors () |
| void | useRainbowColors () |
| virtual bool | usesExternalAttributesModel () const |
| void | useSubduedColors () |
| int | verticalOffset () const override |
| QRect | visualRect (const QModelIndex &index) const override |
| virtual QRegion | visualRegion (const QModelIndex &index) const |
| QRegion | visualRegionForSelection (const QItemSelection &selection) const override |
 Public Member Functions inherited from QAbstractItemView Public Member Functions inherited from QAbstractItemView | |
| QAbstractItemView (QWidget *parent) | |
| void | activated (const QModelIndex &index) |
| bool | alternatingRowColors () const const |
| int | autoScrollMargin () const const |
| void | clearSelection () |
| void | clicked (const QModelIndex &index) |
| void | closePersistentEditor (const QModelIndex &index) |
| QModelIndex | currentIndex () const const |
| Qt::DropAction | defaultDropAction () const const |
| void | doubleClicked (const QModelIndex &index) |
| DragDropMode | dragDropMode () const const |
| bool | dragDropOverwriteMode () const const |
| bool | dragEnabled () const const |
| void | edit (const QModelIndex &index) |
| EditTriggers | editTriggers () const const |
| void | entered (const QModelIndex &index) |
| bool | hasAutoScroll () const const |
| ScrollMode | horizontalScrollMode () const const |
| QSize | iconSize () const const |
| void | iconSizeChanged (const QSize &size) |
| QWidget * | indexWidget (const QModelIndex &index) const const |
| virtual QVariant | inputMethodQuery (Qt::InputMethodQuery query) const const override |
| bool | isPersistentEditorOpen (const QModelIndex &index) const const |
| QAbstractItemDelegate * | itemDelegate () const const |
| QAbstractItemDelegate * | itemDelegate (const QModelIndex &index) const const |
| QAbstractItemDelegate * | itemDelegateForColumn (int column) const const |
| virtual QAbstractItemDelegate * | itemDelegateForIndex (const QModelIndex &index) const const |
| QAbstractItemDelegate * | itemDelegateForRow (int row) const const |
| virtual void | keyboardSearch (const QString &search) |
| QAbstractItemModel * | model () const const |
| void | openPersistentEditor (const QModelIndex &index) |
| void | pressed (const QModelIndex &index) |
| virtual void | reset () |
| void | resetHorizontalScrollMode () |
| void | resetVerticalScrollMode () |
| QModelIndex | rootIndex () const const |
| void | scrollToBottom () |
| void | scrollToTop () |
| virtual void | selectAll () |
| QAbstractItemView::SelectionBehavior | selectionBehavior () const const |
| QAbstractItemView::SelectionMode | selectionMode () const const |
| QItemSelectionModel * | selectionModel () const const |
| void | setAlternatingRowColors (bool enable) |
| void | setAutoScroll (bool enable) |
| void | setAutoScrollMargin (int margin) |
| void | setCurrentIndex (const QModelIndex &index) |
| void | setDefaultDropAction (Qt::DropAction dropAction) |
| void | setDragDropMode (DragDropMode behavior) |
| void | setDragDropOverwriteMode (bool overwrite) |
| void | setDragEnabled (bool enable) |
| void | setDropIndicatorShown (bool enable) |
| void | setEditTriggers (EditTriggers triggers) |
| void | setHorizontalScrollMode (ScrollMode mode) |
| void | setIconSize (const QSize &size) |
| void | setIndexWidget (const QModelIndex &index, QWidget *widget) |
| void | setItemDelegate (QAbstractItemDelegate *delegate) |
| void | setItemDelegateForColumn (int column, QAbstractItemDelegate *delegate) |
| void | setItemDelegateForRow (int row, QAbstractItemDelegate *delegate) |
| void | setSelectionBehavior (QAbstractItemView::SelectionBehavior behavior) |
| void | setSelectionMode (QAbstractItemView::SelectionMode mode) |
| void | setTabKeyNavigation (bool enable) |
| void | setTextElideMode (Qt::TextElideMode mode) |
| void | setVerticalScrollMode (ScrollMode mode) |
| bool | showDropIndicator () const const |
| virtual int | sizeHintForColumn (int column) const const |
| QSize | sizeHintForIndex (const QModelIndex &index) const const |
| virtual int | sizeHintForRow (int row) const const |
| bool | tabKeyNavigation () const const |
| Qt::TextElideMode | textElideMode () const const |
| void | update (const QModelIndex &index) |
| ScrollMode | verticalScrollMode () const const |
| void | viewportEntered () |
| Public Member Functions inherited from QAbstractScrollArea | |
| QAbstractScrollArea (QWidget *parent) | |
| void | addScrollBarWidget (QWidget *widget, Qt::Alignment alignment) |
| QWidget * | cornerWidget () const const |
| QScrollBar * | horizontalScrollBar () const const |
| Qt::ScrollBarPolicy | horizontalScrollBarPolicy () const const |
| QSize | maximumViewportSize () const const |
| virtual QSize | minimumSizeHint () const const override |
| QWidgetList | scrollBarWidgets (Qt::Alignment alignment) |
| void | setCornerWidget (QWidget *widget) |
| void | setHorizontalScrollBar (QScrollBar *scrollBar) |
| void | setHorizontalScrollBarPolicy (Qt::ScrollBarPolicy) |
| void | setSizeAdjustPolicy (SizeAdjustPolicy policy) |
| virtual void | setupViewport (QWidget *viewport) |
| void | setVerticalScrollBar (QScrollBar *scrollBar) |
| void | setVerticalScrollBarPolicy (Qt::ScrollBarPolicy) |
| void | setViewport (QWidget *widget) |
| SizeAdjustPolicy | sizeAdjustPolicy () const const |
| virtual QSize | sizeHint () const const override |
| QScrollBar * | verticalScrollBar () const const |
| Qt::ScrollBarPolicy | verticalScrollBarPolicy () const const |
| QWidget * | viewport () const const |
| Public Member Functions inherited from QFrame | |
| QFrame (QWidget *parent, Qt::WindowFlags f) | |
| QRect | frameRect () const const |
| Shadow | frameShadow () const const |
| Shape | frameShape () const const |
| int | frameStyle () const const |
| int | frameWidth () const const |
| int | lineWidth () const const |
| int | midLineWidth () const const |
| void | setFrameRect (const QRect &) |
| void | setFrameShadow (Shadow) |
| void | setFrameShape (Shape) |
| void | setFrameStyle (int style) |
| void | setLineWidth (int) |
| void | setMidLineWidth (int) |
| Public Member Functions inherited from QWidget | |
| QWidget (QWidget *parent, Qt::WindowFlags f) | |
| bool | acceptDrops () const const |
| QString | accessibleDescription () const const |
| QString | accessibleName () const const |
| QList< QAction * > | actions () const const |
| void | activateWindow () |
| QAction * | addAction (const QIcon &icon, const QString &text) |
| QAction * | addAction (const QIcon &icon, const QString &text, Args &&... args) |
| QAction * | addAction (const QIcon &icon, const QString &text, const QKeySequence &shortcut) |
| QAction * | addAction (const QIcon &icon, const QString &text, const QKeySequence &shortcut, Args &&... args) |
| QAction * | addAction (const QIcon &icon, const QString &text, const QKeySequence &shortcut, const QObject *receiver, const char *member, Qt::ConnectionType type) |
| QAction * | addAction (const QIcon &icon, const QString &text, const QObject *receiver, const char *member, Qt::ConnectionType type) |
| QAction * | addAction (const QString &text) |
| QAction * | addAction (const QString &text, Args &&... args) |
| QAction * | addAction (const QString &text, const QKeySequence &shortcut) |
| QAction * | addAction (const QString &text, const QKeySequence &shortcut, Args &&... args) |
| QAction * | addAction (const QString &text, const QKeySequence &shortcut, const QObject *receiver, const char *member, Qt::ConnectionType type) |
| QAction * | addAction (const QString &text, const QObject *receiver, const char *member, Qt::ConnectionType type) |
| void | addAction (QAction *action) |
| void | addActions (const QList< QAction * > &actions) |
| void | adjustSize () |
| bool | autoFillBackground () const const |
| QPalette::ColorRole | backgroundRole () const const |
| QBackingStore * | backingStore () const const |
| QSize | baseSize () const const |
| QWidget * | childAt (const QPoint &p) const const |
| QWidget * | childAt (int x, int y) const const |
| QRect | childrenRect () const const |
| QRegion | childrenRegion () const const |
| void | clearFocus () |
| void | clearMask () |
| bool | close () |
| QMargins | contentsMargins () const const |
| QRect | contentsRect () const const |
| Qt::ContextMenuPolicy | contextMenuPolicy () const const |
| QCursor | cursor () const const |
| void | customContextMenuRequested (const QPoint &pos) |
| WId | effectiveWinId () const const |
| void | ensurePolished () const const |
| Qt::FocusPolicy | focusPolicy () const const |
| QWidget * | focusProxy () const const |
| QWidget * | focusWidget () const const |
| const QFont & | font () const const |
| QFontInfo | fontInfo () const const |
| QFontMetrics | fontMetrics () const const |
| QPalette::ColorRole | foregroundRole () const const |
| QRect | frameGeometry () const const |
| QSize | frameSize () const const |
| const QRect & | geometry () const const |
| QPixmap | grab (const QRect &rectangle) |
| void | grabGesture (Qt::GestureType gesture, Qt::GestureFlags flags) |
| void | grabKeyboard () |
| void | grabMouse () |
| void | grabMouse (const QCursor &cursor) |
| int | grabShortcut (const QKeySequence &key, Qt::ShortcutContext context) |
| QGraphicsEffect * | graphicsEffect () const const |
| QGraphicsProxyWidget * | graphicsProxyWidget () const const |
| bool | hasEditFocus () const const |
| bool | hasFocus () const const |
| virtual bool | hasHeightForWidth () const const |
| bool | hasMouseTracking () const const |
| bool | hasTabletTracking () const const |
| int | height () const const |
| virtual int | heightForWidth (int w) const const |
| void | hide () |
| Qt::InputMethodHints | inputMethodHints () const const |
| void | insertAction (QAction *before, QAction *action) |
| void | insertActions (QAction *before, const QList< QAction * > &actions) |
| bool | isActiveWindow () const const |
| bool | isAncestorOf (const QWidget *child) const const |
| bool | isEnabled () const const |
| bool | isEnabledTo (const QWidget *ancestor) const const |
| bool | isFullScreen () const const |
| bool | isHidden () const const |
| bool | isMaximized () const const |
| bool | isMinimized () const const |
| bool | isModal () const const |
| bool | isTopLevel () const const |
| bool | isVisible () const const |
| bool | isVisibleTo (const QWidget *ancestor) const const |
| bool | isWindow () const const |
| bool | isWindowModified () const const |
| QLayout * | layout () const const |
| Qt::LayoutDirection | layoutDirection () const const |
| QLocale | locale () const const |
| void | lower () |
| QPoint | mapFrom (const QWidget *parent, const QPoint &pos) const const |
| QPointF | mapFrom (const QWidget *parent, const QPointF &pos) const const |
| QPoint | mapFromGlobal (const QPoint &pos) const const |
| QPointF | mapFromGlobal (const QPointF &pos) const const |
| QPoint | mapFromParent (const QPoint &pos) const const |
| QPointF | mapFromParent (const QPointF &pos) const const |
| QPoint | mapTo (const QWidget *parent, const QPoint &pos) const const |
| QPointF | mapTo (const QWidget *parent, const QPointF &pos) const const |
| QPoint | mapToGlobal (const QPoint &pos) const const |
| QPointF | mapToGlobal (const QPointF &pos) const const |
| QPoint | mapToParent (const QPoint &pos) const const |
| QPointF | mapToParent (const QPointF &pos) const const |
| QRegion | mask () const const |
| int | maximumHeight () const const |
| QSize | maximumSize () const const |
| int | maximumWidth () const const |
| int | minimumHeight () const const |
| QSize | minimumSize () const const |
| int | minimumWidth () const const |
| void | move (const QPoint &) |
| void | move (int x, int y) |
| QWidget * | nativeParentWidget () const const |
| QWidget * | nextInFocusChain () const const |
| QRect | normalGeometry () const const |
| void | overrideWindowFlags (Qt::WindowFlags flags) |
| virtual QPaintEngine * | paintEngine () const const override |
| const QPalette & | palette () const const |
| QWidget * | parentWidget () const const |
| QPoint | pos () const const |
| QWidget * | previousInFocusChain () const const |
| QWIDGETSIZE_MAX QWIDGETSIZE_MAX | |
| void | raise () |
| QRect | rect () const const |
| void | releaseKeyboard () |
| void | releaseMouse () |
| void | releaseShortcut (int id) |
| void | removeAction (QAction *action) |
| void | render (QPaintDevice *target, const QPoint &targetOffset, const QRegion &sourceRegion, RenderFlags renderFlags) |
| void | render (QPainter *painter, const QPoint &targetOffset, const QRegion &sourceRegion, RenderFlags renderFlags) |
| void | repaint () |
| void | repaint (const QRect &rect) |
| void | repaint (const QRegion &rgn) |
| void | repaint (int x, int y, int w, int h) |
| void | resize (const QSize &) |
| void | resize (int w, int h) |
| bool | restoreGeometry (const QByteArray &geometry) |
| QByteArray | saveGeometry () const const |
| QScreen * | screen () const const |
| void | scroll (int dx, int dy) |
| void | scroll (int dx, int dy, const QRect &r) |
| void | setAcceptDrops (bool on) |
| void | setAccessibleDescription (const QString &description) |
| void | setAccessibleName (const QString &name) |
| void | setAttribute (Qt::WidgetAttribute attribute, bool on) |
| void | setAutoFillBackground (bool enabled) |
| void | setBackgroundRole (QPalette::ColorRole role) |
| void | setBaseSize (const QSize &) |
| void | setBaseSize (int basew, int baseh) |
| void | setContentsMargins (const QMargins &margins) |
| void | setContentsMargins (int left, int top, int right, int bottom) |
| void | setContextMenuPolicy (Qt::ContextMenuPolicy policy) |
| void | setCursor (const QCursor &) |
| void | setDisabled (bool disable) |
| void | setEditFocus (bool enable) |
| void | setEnabled (bool) |
| void | setFixedHeight (int h) |
| void | setFixedSize (const QSize &s) |
| void | setFixedSize (int w, int h) |
| void | setFixedWidth (int w) |
| void | setFocus () |
| void | setFocus (Qt::FocusReason reason) |
| void | setFocusPolicy (Qt::FocusPolicy policy) |
| void | setFocusProxy (QWidget *w) |
| void | setFont (const QFont &) |
| void | setForegroundRole (QPalette::ColorRole role) |
| void | setGeometry (const QRect &) |
| void | setGeometry (int x, int y, int w, int h) |
| void | setGraphicsEffect (QGraphicsEffect *effect) |
| void | setHidden (bool hidden) |
| void | setInputMethodHints (Qt::InputMethodHints hints) |
| void | setLayout (QLayout *layout) |
| void | setLayoutDirection (Qt::LayoutDirection direction) |
| void | setLocale (const QLocale &locale) |
| void | setMask (const QBitmap &bitmap) |
| void | setMask (const QRegion ®ion) |
| void | setMaximumHeight (int maxh) |
| void | setMaximumSize (const QSize &) |
| void | setMaximumSize (int maxw, int maxh) |
| void | setMaximumWidth (int maxw) |
| void | setMinimumHeight (int minh) |
| void | setMinimumSize (const QSize &) |
| void | setMinimumSize (int minw, int minh) |
| void | setMinimumWidth (int minw) |
| void | setMouseTracking (bool enable) |
| void | setPalette (const QPalette &) |
| void | setParent (QWidget *parent) |
| void | setParent (QWidget *parent, Qt::WindowFlags f) |
| void | setScreen (QScreen *screen) |
| void | setShortcutAutoRepeat (int id, bool enable) |
| void | setShortcutEnabled (int id, bool enable) |
| void | setSizeIncrement (const QSize &) |
| void | setSizeIncrement (int w, int h) |
| void | setSizePolicy (QSizePolicy) |
| void | setSizePolicy (QSizePolicy::Policy horizontal, QSizePolicy::Policy vertical) |
| void | setStatusTip (const QString &) |
| void | setStyle (QStyle *style) |
| void | setStyleSheet (const QString &styleSheet) |
| void | setTabletTracking (bool enable) |
| void | setToolTip (const QString &) |
| void | setToolTipDuration (int msec) |
| void | setUpdatesEnabled (bool enable) |
| void | setupUi (QWidget *widget) |
| virtual void | setVisible (bool visible) |
| void | setWhatsThis (const QString &) |
| void | setWindowFilePath (const QString &filePath) |
| void | setWindowFlag (Qt::WindowType flag, bool on) |
| void | setWindowFlags (Qt::WindowFlags type) |
| void | setWindowIcon (const QIcon &icon) |
| void | setWindowIconText (const QString &) |
| void | setWindowModality (Qt::WindowModality windowModality) |
| void | setWindowModified (bool) |
| void | setWindowOpacity (qreal level) |
| void | setWindowRole (const QString &role) |
| void | setWindowState (Qt::WindowStates windowState) |
| void | setWindowTitle (const QString &) |
| void | show () |
| void | showFullScreen () |
| void | showMaximized () |
| void | showMinimized () |
| void | showNormal () |
| QSize | size () const const |
| QSize | sizeIncrement () const const |
| QSizePolicy | sizePolicy () const const |
| void | stackUnder (QWidget *w) |
| QString | statusTip () const const |
| QStyle * | style () const const |
| QString | styleSheet () const const |
| bool | testAttribute (Qt::WidgetAttribute attribute) const const |
| QString | toolTip () const const |
| int | toolTipDuration () const const |
| QWidget * | topLevelWidget () const const |
| bool | underMouse () const const |
| void | ungrabGesture (Qt::GestureType gesture) |
| void | unsetCursor () |
| void | unsetLayoutDirection () |
| void | unsetLocale () |
| void | update () |
| void | update (const QRect &rect) |
| void | update (const QRegion &rgn) |
| void | update (int x, int y, int w, int h) |
| void | updateGeometry () |
| bool | updatesEnabled () const const |
| QRegion | visibleRegion () const const |
| QString | whatsThis () const const |
| int | width () const const |
| QWidget * | window () const const |
| QString | windowFilePath () const const |
| Qt::WindowFlags | windowFlags () const const |
| QWindow * | windowHandle () const const |
| QIcon | windowIcon () const const |
| void | windowIconChanged (const QIcon &icon) |
| QString | windowIconText () const const |
| void | windowIconTextChanged (const QString &iconText) |
| Qt::WindowModality | windowModality () const const |
| qreal | windowOpacity () const const |
| QString | windowRole () const const |
| Qt::WindowStates | windowState () const const |
| QString | windowTitle () const const |
| void | windowTitleChanged (const QString &title) |
| Qt::WindowType | windowType () const const |
| WId | winId () const const |
| int | x () const const |
| int | y () const const |
| Public Member Functions inherited from QObject | |
| QObject (QObject *parent) | |
| QBindable< QString > | bindableObjectName () |
| bool | blockSignals (bool block) |
| const QObjectList & | children () const const |
| QMetaObject::Connection | connect (const QObject *sender, const char *signal, const char *method, Qt::ConnectionType type) const const |
| void | deleteLater () |
| void | destroyed (QObject *obj) |
| bool | disconnect (const char *signal, const QObject *receiver, const char *method) const const |
| bool | disconnect (const QObject *receiver, const char *method) const const |
| void | dumpObjectInfo () const const |
| void | dumpObjectTree () const const |
| QList< QByteArray > | dynamicPropertyNames () const const |
| T | findChild (const QString &name, Qt::FindChildOptions options) const const |
| QList< T > | findChildren (const QRegularExpression &re, Qt::FindChildOptions options) const const |
| QList< T > | findChildren (const QString &name, Qt::FindChildOptions options) const const |
| QList< T > | findChildren (Qt::FindChildOptions options) const const |
| bool | inherits (const char *className) const const |
| void | installEventFilter (QObject *filterObj) |
| bool | isQuickItemType () const const |
| bool | isWidgetType () const const |
| bool | isWindowType () const const |
| void | killTimer (int id) |
| virtual const QMetaObject * | metaObject () const const |
| void | moveToThread (QThread *targetThread) |
| QString | objectName () const const |
| void | objectNameChanged (const QString &objectName) |
| QObject * | parent () const const |
| QVariant | property (const char *name) const const |
| Q_CLASSINFO (Name, Value) | |
| Q_EMIT Q_EMIT | |
| Q_ENUM (...) | |
| Q_ENUM_NS (...) | |
| Q_ENUMS (...) | |
| Q_FLAG (...) | |
| Q_FLAG_NS (...) | |
| Q_FLAGS (...) | |
| Q_GADGET Q_GADGET | |
| Q_GADGET_EXPORT (EXPORT_MACRO) | |
| Q_INTERFACES (...) | |
| Q_INVOKABLE Q_INVOKABLE | |
| Q_MOC_INCLUDE Q_MOC_INCLUDE | |
| Q_NAMESPACE Q_NAMESPACE | |
| Q_NAMESPACE_EXPORT (EXPORT_MACRO) | |
| Q_OBJECT Q_OBJECT | |
| Q_PROPERTY (...) | |
| Q_REVISION Q_REVISION | |
| Q_SET_OBJECT_NAME (Object) | |
| Q_SIGNAL Q_SIGNAL | |
| Q_SIGNALS Q_SIGNALS | |
| Q_SLOT Q_SLOT | |
| Q_SLOTS Q_SLOTS | |
| T | qobject_cast (const QObject *object) |
| T | qobject_cast (QObject *object) |
| QT_NO_NARROWING_CONVERSIONS_IN_CONNECT QT_NO_NARROWING_CONVERSIONS_IN_CONNECT | |
| void | removeEventFilter (QObject *obj) |
| void | setObjectName (const QString &name) |
| void | setObjectName (QAnyStringView name) |
| void | setParent (QObject *parent) |
| bool | setProperty (const char *name, const QVariant &value) |
| bool | setProperty (const char *name, QVariant &&value) |
| bool | signalsBlocked () const const |
| int | startTimer (int interval, Qt::TimerType timerType) |
| int | startTimer (std::chrono::milliseconds interval, Qt::TimerType timerType) |
| QThread * | thread () const const |
| Public Member Functions inherited from QPaintDevice | |
| int | colorCount () const const |
| int | depth () const const |
| qreal | devicePixelRatio () const const |
| qreal | devicePixelRatioF () const const |
| int | height () const const |
| int | heightMM () const const |
| int | logicalDpiX () const const |
| int | logicalDpiY () const const |
| bool | paintingActive () const const |
| int | physicalDpiX () const const |
| int | physicalDpiY () const const |
| int | width () const const |
| int | widthMM () const const |
Protected Slots | |
| void | setDataBoundariesDirty () const |
Protected Member Functions | |
| AbstractDiagram (Private *p, QWidget *parent, AbstractCoordinatePlane *plane) | |
| AbstractDiagram (QWidget *parent=nullptr, AbstractCoordinatePlane *plane=nullptr) | |
| QModelIndex | attributesModelRootIndex () const |
| virtual const QPair< QPointF, QPointF > | calculateDataBoundaries () const =0 |
| virtual bool | checkInvariants (bool justReturnTheStatus=false) const |
| virtual void | paintDataValueTexts (QPainter *painter) |
| virtual void | paintMarkers (QPainter *painter) |
| void | setAttributesModelRootIndex (const QModelIndex &) |
| void | setDatasetDimensionInternal (int dimension) |
| qreal | valueForCell (int row, int column) const |
| Protected Member Functions inherited from QAbstractItemView | |
| virtual void | closeEditor (QWidget *editor, QAbstractItemDelegate::EndEditHint hint) |
| virtual void | commitData (QWidget *editor) |
| virtual void | currentChanged (const QModelIndex ¤t, const QModelIndex &previous) |
| virtual void | dataChanged (const QModelIndex &topLeft, const QModelIndex &bottomRight, const QList< int > &roles) |
| QPoint | dirtyRegionOffset () const const |
| virtual void | dragEnterEvent (QDragEnterEvent *event) override |
| virtual void | dragLeaveEvent (QDragLeaveEvent *event) override |
| virtual void | dragMoveEvent (QDragMoveEvent *event) override |
| virtual void | dropEvent (QDropEvent *event) override |
| DropIndicatorPosition | dropIndicatorPosition () const const |
| virtual bool | edit (const QModelIndex &index, EditTrigger trigger, QEvent *event) |
| virtual void | editorDestroyed (QObject *editor) |
| virtual bool | event (QEvent *event) override |
| virtual bool | eventFilter (QObject *object, QEvent *event) override |
| void | executeDelayedItemsLayout () |
| virtual void | focusInEvent (QFocusEvent *event) override |
| virtual bool | focusNextPrevChild (bool next) override |
| virtual void | focusOutEvent (QFocusEvent *event) override |
| virtual void | initViewItemOption (QStyleOptionViewItem *option) const const |
| virtual void | inputMethodEvent (QInputMethodEvent *event) override |
| virtual void | keyPressEvent (QKeyEvent *event) override |
| virtual void | mouseDoubleClickEvent (QMouseEvent *event) override |
| virtual void | mouseMoveEvent (QMouseEvent *event) override |
| virtual void | mousePressEvent (QMouseEvent *event) override |
| virtual void | mouseReleaseEvent (QMouseEvent *event) override |
| virtual void | resizeEvent (QResizeEvent *event) override |
| virtual void | rowsAboutToBeRemoved (const QModelIndex &parent, int start, int end) |
| virtual void | rowsInserted (const QModelIndex &parent, int start, int end) |
| void | scheduleDelayedItemsLayout () |
| void | scrollDirtyRegion (int dx, int dy) |
| virtual QModelIndexList | selectedIndexes () const const |
| virtual void | selectionChanged (const QItemSelection &selected, const QItemSelection &deselected) |
| virtual QItemSelectionModel::SelectionFlags | selectionCommand (const QModelIndex &index, const QEvent *event) const const |
| void | setDirtyRegion (const QRegion ®ion) |
| void | setState (State state) |
| virtual void | startDrag (Qt::DropActions supportedActions) |
| State | state () const const |
| virtual void | timerEvent (QTimerEvent *event) override |
| virtual void | updateGeometries () |
| virtual bool | viewportEvent (QEvent *event) override |
| virtual QSize | viewportSizeHint () const const override |
| Protected Member Functions inherited from QAbstractScrollArea | |
| virtual void | contextMenuEvent (QContextMenuEvent *e) override |
| virtual void | paintEvent (QPaintEvent *event) override |
| virtual void | scrollContentsBy (int dx, int dy) |
| void | setViewportMargins (const QMargins &margins) |
| void | setViewportMargins (int left, int top, int right, int bottom) |
| QMargins | viewportMargins () const const |
| virtual void | wheelEvent (QWheelEvent *e) override |
| Protected Member Functions inherited from QFrame | |
| virtual void | changeEvent (QEvent *ev) override |
| virtual void | initStyleOption (QStyleOptionFrame *option) const const |
| Protected Member Functions inherited from QWidget | |
| virtual void | actionEvent (QActionEvent *event) |
| virtual void | closeEvent (QCloseEvent *event) |
| void | create (WId window, bool initializeWindow, bool destroyOldWindow) |
| void | destroy (bool destroyWindow, bool destroySubWindows) |
| virtual void | enterEvent (QEnterEvent *event) |
| bool | focusNextChild () |
| bool | focusPreviousChild () |
| virtual void | hideEvent (QHideEvent *event) |
| virtual void | initPainter (QPainter *painter) const const override |
| virtual void | keyReleaseEvent (QKeyEvent *event) |
| virtual void | leaveEvent (QEvent *event) |
| virtual int | metric (PaintDeviceMetric m) const const override |
| virtual void | moveEvent (QMoveEvent *event) |
| virtual bool | nativeEvent (const QByteArray &eventType, void *message, qintptr *result) |
| virtual void | showEvent (QShowEvent *event) |
| virtual void | tabletEvent (QTabletEvent *event) |
| void | updateMicroFocus (Qt::InputMethodQuery query) |
| Protected Member Functions inherited from QObject | |
| virtual void | childEvent (QChildEvent *event) |
| virtual void | connectNotify (const QMetaMethod &signal) |
| virtual void | customEvent (QEvent *event) |
| virtual void | disconnectNotify (const QMetaMethod &signal) |
| bool | isSignalConnected (const QMetaMethod &signal) const const |
| int | receivers (const char *signal) const const |
| QObject * | sender () const const |
| int | senderSignalIndex () const const |
Detailed Description
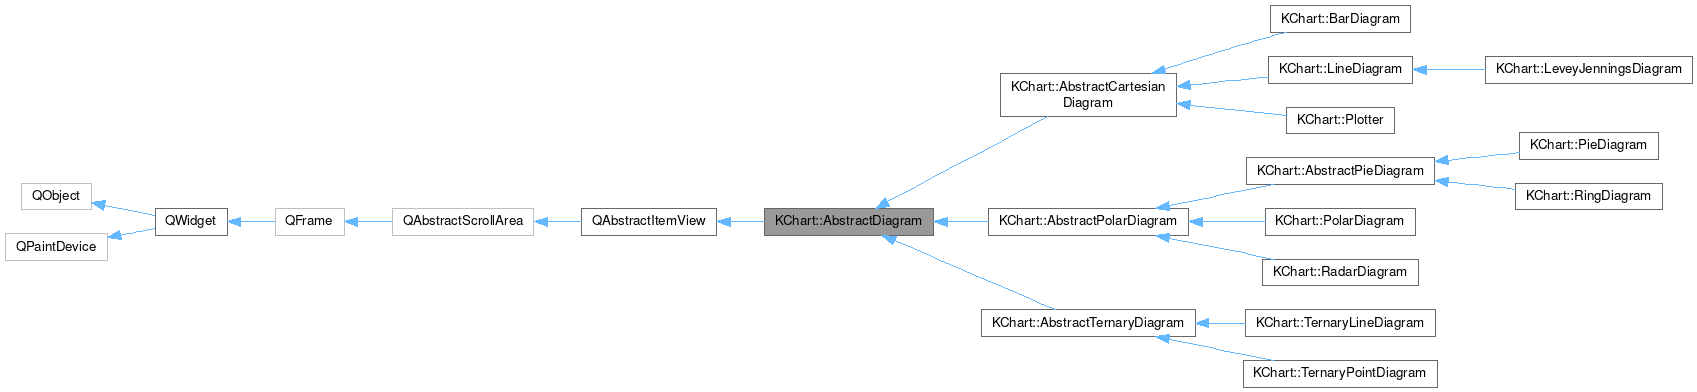
AbstractDiagram defines the interface for diagram classes.
AbstractDiagram is the base class for diagram classes ("chart types").
It defines the interface, that needs to be implemented for the diagram, to function within the KChart framework. It extends Interview's QAbstractItemView.
Definition at line 36 of file KChartAbstractDiagram.h.
Constructor & Destructor Documentation
◆ AbstractDiagram()
|
explicitprotected |
Definition at line 34 of file KChartAbstractDiagram.cpp.
◆ ~AbstractDiagram()
|
override |
Definition at line 41 of file KChartAbstractDiagram.cpp.
Member Function Documentation
◆ aboutToBeDestroyed
|
signal |
This signal is emitted when this diagram is being destroyed, but before all the data, i.e.
the attributes model, is invalidated.
◆ allowOverlappingDataValueTexts()
| bool AbstractDiagram::allowOverlappingDataValueTexts | ( | ) | const |
- Returns
- Whether data value labels are allowed to overlap.
Definition at line 353 of file KChartAbstractDiagram.cpp.
◆ antiAliasing()
| bool AbstractDiagram::antiAliasing | ( | ) | const |
- Returns
- Whether anti-aliasing is to be used for rendering this diagram.
Definition at line 364 of file KChartAbstractDiagram.cpp.
◆ attributesModel()
|
virtual |
Returns the AttributesModel, that is used by this diagram.
By default each diagram owns its own AttributesModel, which should never be deleted. Only if a user-supplied AttributesModel has been set does the pointer returned here not belong to the diagram.
- Returns
- The AttributesModel associated with the diagram.
- See also
- setAttributesModel
Definition at line 187 of file KChartAbstractDiagram.cpp.
◆ attributesModelAboutToChange
|
signal |
This signal is emitted just before the new attributes model is connected internally.
It gives you a chance to connect to its signals first or perform other setup work.
◆ attributesModelRootIndex()
|
protected |
returns a QModelIndex pointing into the AttributesModel that corresponds to the root index of the diagram.
Definition at line 212 of file KChartAbstractDiagram.cpp.
◆ boundariesChanged
|
signal |
Emitted upon change of a data boundary.
◆ brush() [1/3]
| QBrush AbstractDiagram::brush | ( | ) | const |
Retrieve the brush to be used for painting datapoints globally.
This will fall back automatically to the default settings, if there are no specific settings.
- Returns
- The brush to use for painting.
Definition at line 884 of file KChartAbstractDiagram.cpp.
◆ brush() [2/3]
| QBrush AbstractDiagram::brush | ( | const QModelIndex & | index | ) | const |
Retrieve the brush to be used, for painting the datapoint at the given index in the model.
- Parameters
-
index The index of the datapoint in the model. With a dataset dimension of two, this is the index of the key of each key/value pair.
- Returns
- The brush to use for painting.
Definition at line 897 of file KChartAbstractDiagram.cpp.
◆ brush() [3/3]
| QBrush AbstractDiagram::brush | ( | int | dataset | ) | const |
Retrieve the brush to be used for the given dataset.
This will fall back automatically to what was set at model level, if there are no dataset specific settings.
- Parameters
-
dataset The dataset to retrieve the brush for.
- Returns
- The brush to use for painting.
Definition at line 889 of file KChartAbstractDiagram.cpp.
◆ calculateDataBoundaries()
◆ checkInvariants()
|
protectedvirtual |
Definition at line 1126 of file KChartAbstractDiagram.cpp.
◆ compare()
| bool AbstractDiagram::compare | ( | const AbstractDiagram * | other | ) | const |
Returns true if both diagrams have the same settings.
Definition at line 54 of file KChartAbstractDiagram.cpp.
◆ coordinatePlane()
| AbstractCoordinatePlane * AbstractDiagram::coordinatePlane | ( | ) | const |
The coordinate plane associated with the diagram.
This determines how coordinates in value space are mapped into pixel space. By default this is a CartesianCoordinatePlane.
- Returns
- The coordinate plane associated with the diagram.
Definition at line 96 of file KChartAbstractDiagram.cpp.
◆ dataBoundaries()
Return the bottom left and top right data point, that the diagram will display (unless the grid adjusts these values).
This method returns a cached result of calculations done by calculateDataBoundaries. Classes derived from AbstractDiagram must implement the calculateDataBoundaries function, to specify their own way of calculating the data boundaries. If derived classes want to force recalculation of the data boundaries, they can call setDataBoundariesDirty()
Returned value is in diagram coordinates.
Definition at line 101 of file KChartAbstractDiagram.cpp.
◆ dataChanged()
|
override |
\reimpl
Definition at line 233 of file KChartAbstractDiagram.cpp.
◆ dataHidden
|
signal |
This signal is emitted, when the hidden status of at least one data cell was (un)set.
◆ datasetBrushes()
The set of dataset brushes currently used, for use in legends, etc.
- Note
- Cell-level override brushes, if set, take precedence over the dataset values, so you might need to check these too, in order to find the brush, that is used for a single cell.
- Returns
- The current set of dataset brushes.
Definition at line 1087 of file KChartAbstractDiagram.cpp.
◆ datasetDimension()
| int AbstractDiagram::datasetDimension | ( | ) | const |
The dataset dimension of a diagram determines how many value dimensions it expects each datapoint to have.
For each dimension and data series it will expect one column of values in the model. If the dimension is 1, automatic values will be used for X.
For example, a diagram with the default dimension of 1 will have one column per data series (the Y values) and will use automatic values for X (1, 2, 3, ... n). If the dimension is 2, the diagram will use the first, (and the third, fifth, etc) columns as X values, and the second, (and the fourth, sixth, etc) column as Y values.
- Returns
- The dataset dimension of the diagram.
Definition at line 1138 of file KChartAbstractDiagram.cpp.
◆ datasetLabels()
| QStringList AbstractDiagram::datasetLabels | ( | ) | const |
The set of dataset labels currently displayed, for use in legends, etc.
- Returns
- The set of dataset labels currently displayed.
Definition at line 1074 of file KChartAbstractDiagram.cpp.
◆ datasetMarkers()
| QList< MarkerAttributes > AbstractDiagram::datasetMarkers | ( | ) | const |
The set of dataset markers currently used, for use in legends, etc.
- Note
- Cell-level override markers, if set, take precedence over the dataset values, so you might need to check these too, in order to find the marker, that is shown for a single cell.
- Returns
- The current set of dataset brushes.
Definition at line 1113 of file KChartAbstractDiagram.cpp.
◆ datasetPens()
The set of dataset pens currently used, for use in legends, etc.
- Note
- Cell-level override pens, if set, take precedence over the dataset values, so you might need to check these too, in order to find the pens, that is used for a single cell.
- Returns
- The current set of dataset pens.
Definition at line 1100 of file KChartAbstractDiagram.cpp.
◆ dataValueAttributes() [1/3]
| DataValueAttributes AbstractDiagram::dataValueAttributes | ( | ) | const |
Retrieve the DataValueAttributes specified globally.
This will fall back automatically to the default settings, if there are no specific settings.
- Returns
- The global DataValueAttributes.
Definition at line 306 of file KChartAbstractDiagram.cpp.
◆ dataValueAttributes() [2/3]
| DataValueAttributes AbstractDiagram::dataValueAttributes | ( | const QModelIndex & | index | ) | const |
Retrieve the DataValueAttributes for the given index.
This will fall back automatically to what was set at dataset or model level, if there are no datapoint specific settings.
- Parameters
-
index The datapoint to retrieve the attributes for. With a dataset dimension of two, this is the index of the key of each key/value pair.
- Returns
- The DataValueAttributes for the given index.
Definition at line 331 of file KChartAbstractDiagram.cpp.
◆ dataValueAttributes() [3/3]
| DataValueAttributes AbstractDiagram::dataValueAttributes | ( | int | dataset | ) | const |
Retrieve the DataValueAttributes for the given dataset.
This will fall back automatically to what was set at model level, if there are no dataset specific settings.
- Parameters
-
dataset The dataset to retrieve the attributes for.
- Returns
- The DataValueAttributes for the given dataset.
Definition at line 311 of file KChartAbstractDiagram.cpp.
◆ doItemsLayout()
|
override |
\reimpl
Definition at line 224 of file KChartAbstractDiagram.cpp.
◆ horizontalOffset()
|
overridevirtual |
◆ indexAt()
|
overridevirtual |
◆ indexesAt()
| QModelIndexList AbstractDiagram::indexesAt | ( | const QPoint & | point | ) | const |
This method is added alongside with indexAt from QAIM, since in KChart multiple indexes can be displayed at the same spot.
Definition at line 1184 of file KChartAbstractDiagram.cpp.
◆ indexesIn()
| QModelIndexList AbstractDiagram::indexesIn | ( | const QRect & | rect | ) | const |
Definition at line 1189 of file KChartAbstractDiagram.cpp.
◆ isHidden() [1/3]
| bool AbstractDiagram::isHidden | ( | ) | const |
Retrieve the hidden status specified globally.
This will fall back automatically to the default settings ( = not hidden), if there are no specific settings.
- Returns
- The global hidden status.
Definition at line 266 of file KChartAbstractDiagram.cpp.
◆ isHidden() [2/3]
| bool AbstractDiagram::isHidden | ( | const QModelIndex & | index | ) | const |
Retrieve the hidden status for the given index.
This will fall back automatically to what was set at dataset or diagram level, if there are no datapoint specific settings.
- Parameters
-
index The datapoint to retrieve the hidden status for.
- Returns
- The hidden status for the given index.
Definition at line 279 of file KChartAbstractDiagram.cpp.
◆ isHidden() [3/3]
| bool AbstractDiagram::isHidden | ( | int | dataset | ) | const |
Retrieve the hidden status for the given dataset.
This will fall back automatically to what was set at diagram level, if there are no dataset specific settings.
- Parameters
-
dataset The dataset to retrieve the hidden status for.
- Returns
- The hidden status for the given dataset.
Definition at line 271 of file KChartAbstractDiagram.cpp.
◆ isIndexHidden()
|
overridevirtual |
◆ itemRowLabels()
| QStringList AbstractDiagram::itemRowLabels | ( | ) | const |
The set of item row labels currently displayed, for use in Abscissa axes, etc.
- Returns
- The set of item row labels currently displayed.
Definition at line 1058 of file KChartAbstractDiagram.cpp.
◆ layoutChanged
|
signal |
Diagrams are supposed to emit this signal, when the layout of one of their element changes.
Layouts can change, for example, when axes are added or removed, or when the configuration was changed in a way that the axes or the diagram itself are displayed in a different geometry. Changes in the diagrams coordinate system also result in the layoutChanged() signal being emitted.
◆ modelDataChanged
|
signal |
This signal is emitted, when the model data is changed.
◆ modelsChanged
|
signal |
This signal is emitted when either the model or the AttributesModel is replaced.
◆ moveCursor()
|
overridevirtual |
◆ paint()
|
pure virtual |
Draw the diagram contents to the rectangle and painter, that are passed in as part of the paint context.
- Parameters
-
paintContext All information needed for painting.
Implemented in KChart::BarDiagram, KChart::LeveyJenningsDiagram, KChart::LineDiagram, KChart::PieDiagram, KChart::Plotter, KChart::PolarDiagram, KChart::RadarDiagram, KChart::RingDiagram, KChart::TernaryLineDiagram, and KChart::TernaryPointDiagram.
◆ paintDataValueText()
| void AbstractDiagram::paintDataValueText | ( | QPainter * | painter, |
| const QModelIndex & | index, | ||
| const QPointF & | pos, | ||
| qreal | value ) |
Definition at line 381 of file KChartAbstractDiagram.cpp.
◆ paintDataValueTexts()
|
protectedvirtual |
- Deprecated
- This method is deprecated and provided for backward-compatibility only. Your own diagram classes should call d->paintDataValueTextsAndMarkers() instead which also is taking care for showing your cell-specific comments, if any,
Definition at line 390 of file KChartAbstractDiagram.cpp.
◆ paintMarker() [1/3]
| void AbstractDiagram::paintMarker | ( | QPainter * | painter, |
| const DataValueAttributes & | a, | ||
| const QModelIndex & | index, | ||
| const QPointF & | pos ) |
Definition at line 417 of file KChartAbstractDiagram.cpp.
◆ paintMarker() [2/3]
|
virtual |
Definition at line 476 of file KChartAbstractDiagram.cpp.
◆ paintMarker() [3/3]
| void AbstractDiagram::paintMarker | ( | QPainter * | painter, |
| const QModelIndex & | index, | ||
| const QPointF & | pos ) |
Definition at line 468 of file KChartAbstractDiagram.cpp.
◆ paintMarkers()
|
protectedvirtual |
- Deprecated
- This method is deprecated and provided for backward-compatibility only. Your own diagram classes should call d->paintDataValueTextsAndMarkers() instead which also is taking care for showing your cell-specific comments, if any,
Definition at line 796 of file KChartAbstractDiagram.cpp.
◆ pen() [1/3]
| QPen AbstractDiagram::pen | ( | ) | const |
Retrieve the pen to be used for painting datapoints globally.
This will fall back automatically to the default settings, if there are no specific settings.
- Returns
- The pen to use for painting.
Definition at line 843 of file KChartAbstractDiagram.cpp.
◆ pen() [2/3]
| QPen AbstractDiagram::pen | ( | const QModelIndex & | index | ) | const |
Retrieve the pen to be used, for painting the datapoint at the given index in the model.
- Parameters
-
index The index of the datapoint in the model. With a dataset dimension of two, this is the index of the key of each key/value pair.
- Returns
- The pen to use for painting.
Definition at line 856 of file KChartAbstractDiagram.cpp.
◆ pen() [3/3]
| QPen AbstractDiagram::pen | ( | int | dataset | ) | const |
Retrieve the pen to be used for the given dataset.
This will fall back automatically to what was set at model level, if there are no dataset specific settings.
- Parameters
-
dataset The dataset to retrieve the pen for.
- Returns
- The pen to use for painting.
Definition at line 848 of file KChartAbstractDiagram.cpp.
◆ percentMode()
| bool AbstractDiagram::percentMode | ( | ) | const |
Returns whether this diagram is drawn in percent mode.
If true, all data points in the same column of a diagram will be be drawn at the same X coordinate and stacked up so that the distance from the last data point (or the zero line) to a data point P is always the ratio of (Y-Value of P)/ (sum of all Y-Values in same column as P) relative to the diagrams height (or width, if abscissa and ordinate are swapped).
Note that this property is not applicable to all diagram types.
Definition at line 375 of file KChartAbstractDiagram.cpp.
◆ propertiesChanged
|
signal |
Emitted upon change of a property of the Diagram.
◆ resize()
|
virtual |
Called by the widget's sizeEvent.
Adjust all internal structures, that are calculated, dependending on the size of the widget.
- Parameters
-
area
Reimplemented in KChart::BarDiagram, KChart::LineDiagram, KChart::PieDiagram, KChart::Plotter, KChart::PolarDiagram, KChart::RadarDiagram, KChart::RingDiagram, KChart::TernaryLineDiagram, and KChart::TernaryPointDiagram.
Definition at line 116 of file KChartAbstractDiagram.cpp.
◆ scrollTo()
|
overridevirtual |
◆ setAllowOverlappingDataValueTexts()
| void AbstractDiagram::setAllowOverlappingDataValueTexts | ( | bool | allow | ) |
Set whether data value labels are allowed to overlap.
- Parameters
-
allow True means that overlapping labels are allowed.
Definition at line 344 of file KChartAbstractDiagram.cpp.
◆ setAntiAliasing()
| void AbstractDiagram::setAntiAliasing | ( | bool | enabled | ) |
Set whether anti-aliasing is to be used while rendering this diagram.
- Parameters
-
enabled True means that AA is enabled.
Definition at line 358 of file KChartAbstractDiagram.cpp.
◆ setAttributesModel()
|
virtual |
Associate an AttributesModel with this diagram.
Note that the diagram does not take ownership of the AttributesModel. This should thus only be used with AttributesModels that have been explicitly created by the user, and are owned by her. Setting an AttributesModel that is internal to another diagram is an error.
Correct:
Wrong:
- Parameters
-
model The AttributesModel to use for this diagram.
Reimplemented in KChart::AbstractCartesianDiagram.
Definition at line 162 of file KChartAbstractDiagram.cpp.
◆ setAttributesModelRootIndex()
|
protected |
Definition at line 205 of file KChartAbstractDiagram.cpp.
◆ setBrush() [1/3]
| void AbstractDiagram::setBrush | ( | const QBrush & | brush | ) |
Set the brush to be used, for painting all datasets in the model.
- Parameters
-
brush The brush to use.
Definition at line 871 of file KChartAbstractDiagram.cpp.
◆ setBrush() [2/3]
| void AbstractDiagram::setBrush | ( | const QModelIndex & | index, |
| const QBrush & | brush ) |
Set the brush to be used, for painting the datapoint at the given index.
- Parameters
-
index The datapoint's index in the model. With a dataset dimension of two, this is the index of the key of each key/value pair. brush The brush to use.
Definition at line 863 of file KChartAbstractDiagram.cpp.
◆ setBrush() [3/3]
| void AbstractDiagram::setBrush | ( | int | dataset, |
| const QBrush & | brush ) |
Set the brush to be used, for painting the given dataset.
- Parameters
-
dataset The dataset to set the brush for. brush The brush to use.
Definition at line 878 of file KChartAbstractDiagram.cpp.
◆ setCoordinatePlane()
|
virtual |
Set the coordinate plane associated with the diagram.
This determines how coordinates in value space are mapped into pixel space. The chart takes ownership.
Reimplemented in KChart::AbstractCartesianDiagram.
Definition at line 219 of file KChartAbstractDiagram.cpp.
◆ setDataBoundariesDirty
|
protectedslot |
Definition at line 110 of file KChartAbstractDiagram.cpp.
◆ setDatasetDimension()
| void AbstractDiagram::setDatasetDimension | ( | int | dimension | ) |
Sets the dataset dimension of the diagram. Using this method is deprecated. Use the specific diagram types instead.
Definition at line 1143 of file KChartAbstractDiagram.cpp.
◆ setDatasetDimensionInternal()
|
protected |
Definition at line 1150 of file KChartAbstractDiagram.cpp.
◆ setDataValueAttributes() [1/3]
| void AbstractDiagram::setDataValueAttributes | ( | const DataValueAttributes & | a | ) |
Set the DataValueAttributes for all datapoints in the model.
- Parameters
-
a The attributes to set.
Definition at line 338 of file KChartAbstractDiagram.cpp.
◆ setDataValueAttributes() [2/3]
| void AbstractDiagram::setDataValueAttributes | ( | const QModelIndex & | index, |
| const DataValueAttributes & | a ) |
Set the DataValueAttributes for the given index.
- Parameters
-
index The datapoint to set the attributes for. With a dataset dimension of two, this is the index of the key of each key/value pair. a The attributes to set.
Definition at line 291 of file KChartAbstractDiagram.cpp.
◆ setDataValueAttributes() [3/3]
| void AbstractDiagram::setDataValueAttributes | ( | int | dataset, |
| const DataValueAttributes & | a ) |
Set the DataValueAttributes for the given dataset.
- Parameters
-
dataset The dataset to set the attributes for. a The attributes to set.
Definition at line 300 of file KChartAbstractDiagram.cpp.
◆ setHidden() [1/3]
| void AbstractDiagram::setHidden | ( | bool | hidden | ) |
Hide (or unhide, resp.) all datapoints in the model.
- Note
- Hidden data are still taken into account by the coordinate plane, so neither the grid nor your axes' ranges will change, when you hide data. For totally removing data from KChart's view you can use another approach: e.g. you could define a proxy model on top of your data model, and register the proxy model calling setModel() instead of registering your real data model.
- Parameters
-
hidden The hidden status to set.
Definition at line 260 of file KChartAbstractDiagram.cpp.
◆ setHidden() [2/3]
| void AbstractDiagram::setHidden | ( | const QModelIndex & | index, |
| bool | hidden ) |
Hide (or unhide, resp.) a data cell.
- Note
- Hidden data are still taken into account by the coordinate plane, so neither the grid nor your axes' ranges will change, when you hide data. For totally removing data from KChart's view you can use another approach: e.g. you could define a proxy model on top of your data model, and register the proxy model calling setModel() instead of registering your real data model.
- Parameters
-
index The datapoint to set the hidden status for. With a dataset dimension of two, this is the index of the key of each key/value pair. hidden The hidden status to set.
Definition at line 245 of file KChartAbstractDiagram.cpp.
◆ setHidden() [3/3]
| void AbstractDiagram::setHidden | ( | int | dataset, |
| bool | hidden ) |
Hide (or unhide, resp.) a dataset.
- Note
- Hidden data are still taken into account by the coordinate plane, so neither the grid nor your axes' ranges will change, when you hide data. For totally removing data from KChart's view you can use another approach: e.g. you could define a proxy model on top of your data model, and register the proxy model calling setModel() instead of registering your real data model.
- Parameters
-
dataset The dataset to set the hidden status for. hidden The hidden status to set.
Definition at line 254 of file KChartAbstractDiagram.cpp.
◆ setModel()
|
overridevirtual |
Associate a model with the diagram.
Reimplemented from QAbstractItemView.
Definition at line 122 of file KChartAbstractDiagram.cpp.
◆ setPen() [1/3]
| void AbstractDiagram::setPen | ( | const QModelIndex & | index, |
| const QPen & | pen ) |
Set the pen to be used, for painting the datapoint at the given index.
- Parameters
-
index The datapoint's index in the model. With a dataset dimension of two, this is the index of the key of each key/value pair. pen The pen to use.
Definition at line 822 of file KChartAbstractDiagram.cpp.
◆ setPen() [2/3]
| void AbstractDiagram::setPen | ( | const QPen & | pen | ) |
Set the pen to be used, for painting all datasets in the model.
- Parameters
-
pen The pen to use.
Definition at line 830 of file KChartAbstractDiagram.cpp.
◆ setPen() [3/3]
| void AbstractDiagram::setPen | ( | int | dataset, |
| const QPen & | pen ) |
Set the pen to be used, for painting the given dataset.
- Parameters
-
dataset The dataset to set the pen for. pen The pen to use.
Definition at line 837 of file KChartAbstractDiagram.cpp.
◆ setPercentMode()
| void AbstractDiagram::setPercentMode | ( | bool | percent | ) |
Deprecated method that turns the percent mode of this diagram on or off.
This method is deprecated. Use the setType() method of a supporting diagram implementation instead, e.g. BarDiagram::setType().
- See also
- percentMode
Definition at line 369 of file KChartAbstractDiagram.cpp.
◆ setRootIndex()
|
overridevirtual |
Set the root index in the model, where the diagram starts referencing data for display.
Reimplemented from QAbstractItemView.
Definition at line 199 of file KChartAbstractDiagram.cpp.
◆ setSelection()
|
overridevirtual |
◆ setSelectionModel()
|
overridevirtual |
Associate a seleection model with the diagrom.
Reimplemented from QAbstractItemView.
Definition at line 139 of file KChartAbstractDiagram.cpp.
◆ setUnitPrefix() [1/2]
| void AbstractDiagram::setUnitPrefix | ( | const QString & | prefix, |
| int | column, | ||
| Qt::Orientation | orientation ) |
Set the unit prefix to be used on axes for one specific column.
- Parameters
-
prefix The prefix to be used. column The column which should be set. orientation The orientation of the axis to use.
Definition at line 909 of file KChartAbstractDiagram.cpp.
◆ setUnitPrefix() [2/2]
| void AbstractDiagram::setUnitPrefix | ( | const QString & | prefix, |
| Qt::Orientation | orientation ) |
Set the unit prefix to be used on axes for all columns.
- Parameters
-
prefix The prefix to be used. orientation The orientation of the axis to use.
Definition at line 919 of file KChartAbstractDiagram.cpp.
◆ setUnitSuffix() [1/2]
| void AbstractDiagram::setUnitSuffix | ( | const QString & | suffix, |
| int | column, | ||
| Qt::Orientation | orientation ) |
Set the unit prefix to be used on axes for one specific column.
- Parameters
-
suffix The suffix to be used. column The column which should be set. orientation The orientation of the axis to use.
Definition at line 930 of file KChartAbstractDiagram.cpp.
◆ setUnitSuffix() [2/2]
| void AbstractDiagram::setUnitSuffix | ( | const QString & | suffix, |
| Qt::Orientation | orientation ) |
Set the unit prefix to be used on axes for all columns.
- Parameters
-
suffix The suffix to be used. orientation The orientation of the axis to use.
Definition at line 940 of file KChartAbstractDiagram.cpp.
◆ unitPrefix() [1/2]
| QString AbstractDiagram::unitPrefix | ( | int | column, |
| Qt::Orientation | orientation, | ||
| bool | fallback = false ) const |
Retrieves the axis unit prefix for a specific column.
- Parameters
-
column The column whose prefix should be retrieved. orientation The orientation of the axis. fallback If true, the prefix for all columns is returned, when none is set for the selected column.
- Returns
- The axis unit prefix.
Definition at line 952 of file KChartAbstractDiagram.cpp.
◆ unitPrefix() [2/2]
| QString AbstractDiagram::unitPrefix | ( | Qt::Orientation | orientation | ) | const |
Retrieves the axis unit prefix.
- Parameters
-
orientation The orientation of the axis.
- Returns
- The axis unit prefix.
Definition at line 963 of file KChartAbstractDiagram.cpp.
◆ unitSuffix() [1/2]
| QString AbstractDiagram::unitSuffix | ( | int | column, |
| Qt::Orientation | orientation, | ||
| bool | fallback = false ) const |
Retrieves the axis unit suffix for a specific column.
- Parameters
-
column The column whose prefix should be retrieved. orientation The orientation of the axis. fallback If true, the suffix for all columns is returned, when none is set for the selected column.
- Returns
- The axis unit suffix.
Definition at line 975 of file KChartAbstractDiagram.cpp.
◆ unitSuffix() [2/2]
| QString AbstractDiagram::unitSuffix | ( | Qt::Orientation | orientation | ) | const |
Retrieves the axis unit suffix.
- Parameters
-
orientation The orientation of the axis.
- Returns
- The axis unit suffix.
Definition at line 986 of file KChartAbstractDiagram.cpp.
◆ update()
| void AbstractDiagram::update | ( | ) | const |
Definition at line 1172 of file KChartAbstractDiagram.cpp.
◆ useDefaultColors()
| void KChart::AbstractDiagram::useDefaultColors | ( | ) |
Set the palette to be used, for painting datasets to the default palette.
- See also
- KChart::Palette. FIXME: fold into one usePalette (KChart::Palette&) method
Definition at line 1043 of file KChartAbstractDiagram.cpp.
◆ useRainbowColors()
| void KChart::AbstractDiagram::useRainbowColors | ( | ) |
Set the palette to be used, for painting datasets to the rainbow palette.
- See also
- KChart::Palette.
Definition at line 1053 of file KChartAbstractDiagram.cpp.
◆ usesExternalAttributesModel()
|
virtual |
Returns whether the diagram is using its own built-in attributes model or an attributes model that was set via setAttributesModel.
- See also
- setAttributesModel
Definition at line 182 of file KChartAbstractDiagram.cpp.
◆ useSubduedColors()
| void KChart::AbstractDiagram::useSubduedColors | ( | ) |
Set the palette to be used, for painting datasets to the subdued palette.
- See also
- KChart::Palette.
Definition at line 1048 of file KChartAbstractDiagram.cpp.
◆ valueForCell()
|
protected |
Helper method, retrieving the data value (DisplayRole) for a given row and column.
- Parameters
-
row The row to query. column The column to query.
- Returns
- The value of the display role at the given row and column as a qreal.
Definition at line 1162 of file KChartAbstractDiagram.cpp.
◆ verticalOffset()
|
overridevirtual |
◆ viewportCoordinateSystemChanged
|
signal |
Emitted upon change of the view coordinate system.
◆ visualRect()
|
overridevirtual |
◆ visualRegion()
|
virtual |
Definition at line 1037 of file KChartAbstractDiagram.cpp.
◆ visualRegionForSelection()
|
overridevirtual |
The documentation for this class was generated from the following files:
Documentation copyright © 1996-2025 The KDE developers.
Generated on Fri May 2 2025 11:54:25 by doxygen 1.13.2 written by Dimitri van Heesch, © 1997-2006
KDE's Doxygen guidelines are available online.