BarChart QML Type
An item to render a bar chart. More...
| Import Statement: | import org.kde.quickcharts |
| Inherits: |
Properties
- backgroundColor : color
- barWidth : real
- orientation : enumeration
- radius : real
- spacing : real
Detailed Description
This chart renders
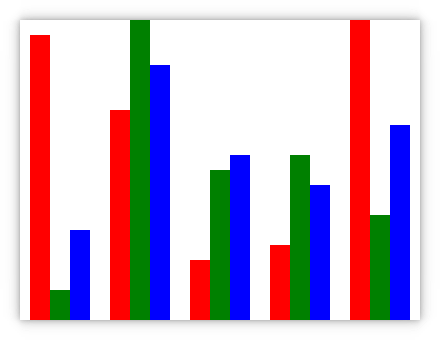
Usage example
import QtQuick
import QtQuick.Controls

import org.kde.quickcharts as Charts

Charts.BarChart {
    id: barChart

    width: 400
    height: 300

    valueSources: [
        Charts.ModelSource { roleName: "value1"; model: listModel },
        Charts.ModelSource { roleName: "value2"; model: listModel },
        Charts.ModelSource { roleName: "value3"; model: listModel }
    ]

    colorSource: Charts.ArraySource { array: ["red", "green", "blue"] }
    nameSource: Charts.ArraySource { array: ["Example 1", "Example 2", "Example 3"] }

    barWidth: 20

    ListModel {
        id: listModel

        ListElement { value1: 19; value2: 2; value3: 6 }
        ListElement { value1: 14; value2: 20; value3: 17 }
        ListElement { value1: 4; value2: 10; value3: 11 }
        ListElement { value1: 5; value2: 11; value3: 9 }
        ListElement { value1: 20; value2: 7; value3: 13 }
    }
}
Property Documentation
backgroundColor : color
The background color of bars in the chart.
By default this is Qt::transparent. If set to something non-transparent, the chart will render backgrounds for the bars. These backgrounds will have the same width as the bars but stretch the full height.
barWidth : real
The width of individual bars in the chart.
If set to BarChart.AutoWidth (also the default), the width will be calculated automatically based on total chart width and item count.
orientation : enumeration
The orientation of bars in the chart.
By default this is BarChart.VerticalOrientation.
| Constant | Description |
|---|---|
BarChart.HorizontalOrientation | Bars are oriented horizontally, with low values left and high values right. |
BarChart.VerticalOrientation | Bars are oriented vertically, with low values at the bottom and high values at the top. |
radius : real
The radius of the ends of bars in the chart in pixels.
By default this is 0, which means no rounding will be done.
spacing : real
The spacing between bars for each value source.
Note that spacing between each X axis value is determined automatically based on barWidth, spacing and total chart width. The default is 0.