 KDE API Reference
Analitza
#include <plotsview2d.h>
Public Types | |
| enum | Format { PNG, SVG } |
| enum | GraphMode { None =0, Pan, Selection } |
Public Slots | |
| void | forceRepaint () |
| bool | isFramed () const |
| bool | isReadOnly () const |
| void | resetViewport () |
| void | setAxesShown (QFlags< Qt::Orientation > o) |
| void | setFramed (bool fr) |
| void | setReadOnly (bool ro) |
| void | setTicksShown (QFlags< Qt::Orientation > o) |
| void | setXAxisLabel (const QString &label) |
| void | setYAxisLabel (const QString &label) |
| void | snapshotToClipboard () |
| void | updateGridColor (const QColor &color) |
| void | updateTickScale (QString s, qreal v, int n, int d) |
| void | zoomIn () |
| void | zoomOut () |
Signals | |
| void | status (const QString &msg) |
| void | viewportChanged (const QRectF &) |
Public Member Functions | |
| PlotsView2D (QWidget *parent=0) | |
| ~PlotsView2D () | |
| QRectF | definedViewport () const |
| void | setSelectionModel (QItemSelectionModel *selection) |
| virtual void | showEvent (QShowEvent *ev) |
| QSize | sizeHint () const |
| bool | toImage (const QString &path, Format f) |
 Public Member Functions inherited from Analitza::Plotter2D Public Member Functions inherited from Analitza::Plotter2D | |
| Plotter2D (const QSizeF &size) | |
| virtual | ~Plotter2D () |
| virtual void | forceRepaint ()=0 |
| bool | keepAspectRatio () const |
| QAbstractItemModel * | model () const |
| void | moveViewport (const QPoint &delta) |
| void | setAxesShown (Qt::Orientations o) |
| void | setKeepAspectRatio (bool ar) |
| void | setModel (QAbstractItemModel *f) |
| void | setSquares (bool newSquare) |
| void | setTicksShown (Qt::Orientations o) |
| void | setViewport (const QRectF &vp, bool repaint=true) |
| void | setXAxisLabel (const QString &label) |
| void | setYAxisLabel (const QString &label) |
| bool | squares () const |
| Qt::Orientations | ticksShown () const |
| void | updateFunctions (const QModelIndex &parent, int start, int end) |
| void | updateGridColor (const QColor &color) |
| void | updateTickScale (const QString &m_tickScaleSymbol, qreal m_tickScaleSymbolValue, int m_tickScaleNumerator, int m_tickScaleDenominator) |
Properties | |
| bool | squares |
Additional Inherited Members | |
| Protected Member Functions inherited from Analitza::Plotter2D | |
| QPair< QPointF, QString > | calcImage (const QPointF &ndp) const |
| QPointF | fromWidget (const QPoint &p) const |
| QRectF | lastUserViewport () const |
| QRectF | lastViewport () const |
| void | scaleViewport (qreal s, const QPoint ¢er) |
| void | setPaintedSize (const QSize &size) |
| QLineF | slope (const QPointF &dp) const |
| QPointF | toViewport (const QPoint &mv) const |
| QPointF | toWidget (const QPointF &) const |
| QLineF | toWidget (const QLineF &) const |
| void | updateScale (bool repaint) |
Detailed Description
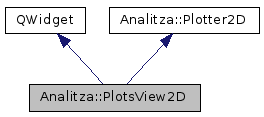
Widget that allows visualization of 2D plots.
This class lets you create a widget that can draw multiple 2D graphs. This widget use Plotter2D as a backend.
Definition at line 55 of file plotsview2d.h.
Member Enumeration Documentation
| Enumerator | |
|---|---|
| PNG | |
| SVG | |
Definition at line 67 of file plotsview2d.h.
The graph mode will especify the selection mode we are using at the moment.
| Enumerator | |
|---|---|
| None |
Normal behaviour. |
| Pan |
Panning, translates the viewport. |
| Selection |
There is a rectangle delimiting a region, for zooming. |
Definition at line 61 of file plotsview2d.h.
Constructor & Destructor Documentation
| Analitza::PlotsView2D::PlotsView2D | ( | QWidget * | parent = 0 | ) |
Constructor.
Constructs a new Graph2D.
| Analitza::PlotsView2D::~PlotsView2D | ( | ) |
Member Function Documentation
| QRectF Analitza::PlotsView2D::definedViewport | ( | ) | const |
Returns the viewing port.
|
inlineslot |
Marks the image as dirty and repaints everything.
Definition at line 88 of file plotsview2d.h.
|
inlineslot |
Returns whether it has a little border frame.
Definition at line 100 of file plotsview2d.h.
|
inlineslot |
Returns whether it is a read-only widget.
Definition at line 106 of file plotsview2d.h.
|
inlineslot |
Sets the viewport to a default viewport.
Definition at line 91 of file plotsview2d.h.
|
inlineslot |
Definition at line 119 of file plotsview2d.h.
|
inlineslot |
Sets whether it has a little border frame.
Definition at line 103 of file plotsview2d.h.
|
slot |
Sets whether it is a read-only widget.
| void Analitza::PlotsView2D::setSelectionModel | ( | QItemSelectionModel * | selection | ) |
|
inlineslot |
Definition at line 118 of file plotsview2d.h.
|
inlineslot |
Definition at line 114 of file plotsview2d.h.
|
inlineslot |
Definition at line 115 of file plotsview2d.h.
|
virtual |
|
inline |
Definition at line 74 of file plotsview2d.h.
|
slot |
|
signal |
Emits a status when it changes.
| bool Analitza::PlotsView2D::toImage | ( | const QString & | path, |
| Format | f | ||
| ) |
Saves the graphs to a file located at path.
|
inlineslot |
Definition at line 116 of file plotsview2d.h.
|
inlineslot |
Definition at line 117 of file plotsview2d.h.
|
signal |
|
slot |
Zooms in to the Viewport center.
|
slot |
Zooms out.
Property Documentation
|
readwrite |
Definition at line 58 of file plotsview2d.h.
The documentation for this class was generated from the following file:
Documentation copyright © 1996-2014 The KDE developers.
Generated on Tue Oct 14 2014 22:35:21 by doxygen 1.8.7 written by Dimitri van Heesch, © 1997-2006
KDE's Doxygen guidelines are available online.