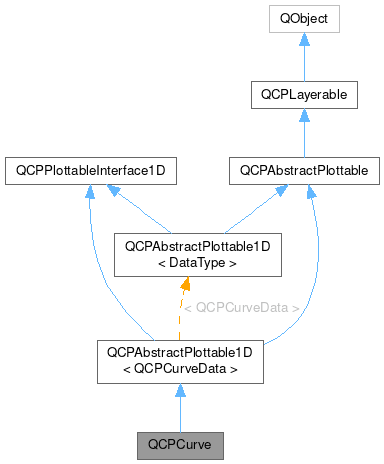
QCPCurve
Public Types | |
| enum | LineStyle { lsNone , lsLine } |
Public Member Functions | |
| QCPCurve (QCPAxis *keyAxis, QCPAxis *valueAxis) | |
| void | addData (const QVector< double > &keys, const QVector< double > &values) |
| void | addData (const QVector< double > &t, const QVector< double > &keys, const QVector< double > &values, bool alreadySorted=false) |
| void | addData (double key, double value) |
| void | addData (double t, double key, double value) |
| QSharedPointer< QCPCurveDataContainer > | data () const |
| virtual QCPRange | getKeyRange (bool &foundRange, QCP::SignDomain inSignDomain=QCP::sdBoth) const override |
| virtual QCPRange | getValueRange (bool &foundRange, QCP::SignDomain inSignDomain=QCP::sdBoth, const QCPRange &inKeyRange=QCPRange()) const override |
| LineStyle | lineStyle () const |
| int | scatterSkip () const |
| QCPScatterStyle | scatterStyle () const |
| virtual double | selectTest (const QPointF &pos, bool onlySelectable, QVariant *details=nullptr) const override |
| void | setData (const QVector< double > &keys, const QVector< double > &values) |
| void | setData (const QVector< double > &t, const QVector< double > &keys, const QVector< double > &values, bool alreadySorted=false) |
| void | setData (QSharedPointer< QCPCurveDataContainer > data) |
| void | setLineStyle (LineStyle style) |
| void | setScatterSkip (int skip) |
| void | setScatterStyle (const QCPScatterStyle &style) |
 Public Member Functions inherited from QCPAbstractPlottable1D< QCPCurveData > Public Member Functions inherited from QCPAbstractPlottable1D< QCPCurveData > | |
| QCPAbstractPlottable1D (QCPAxis *keyAxis, QCPAxis *valueAxis) | |
| virtual int | dataCount () const override |
| virtual double | dataMainKey (int index) const override |
| virtual double | dataMainValue (int index) const override |
| virtual QPointF | dataPixelPosition (int index) const override |
| virtual double | dataSortKey (int index) const override |
| virtual QCPRange | dataValueRange (int index) const override |
| virtual int | findBegin (double sortKey, bool expandedRange=true) const override |
| virtual int | findEnd (double sortKey, bool expandedRange=true) const override |
| virtual QCPPlottableInterface1D * | interface1D () override |
| virtual QCPDataSelection | selectTestRect (const QRectF &rect, bool onlySelectable) const override |
| virtual bool | sortKeyIsMainKey () const override |
| Public Member Functions inherited from QCPAbstractPlottable | |
| QCPAbstractPlottable (QCPAxis *keyAxis, QCPAxis *valueAxis) | |
| bool | addToLegend () |
| bool | addToLegend (QCPLegend *legend) |
| bool | antialiasedFill () const |
| bool | antialiasedScatters () const |
| QBrush | brush () const |
| const QPointF | coordsToPixels (double key, double value) const |
| void | coordsToPixels (double key, double value, double &x, double &y) const |
| QCPAxis * | keyAxis () const |
| QString | name () const |
| QPen | pen () const |
| void | pixelsToCoords (const QPointF &pixelPos, double &key, double &value) const |
| void | pixelsToCoords (double x, double y, double &key, double &value) const |
| bool | removeFromLegend () const |
| bool | removeFromLegend (QCPLegend *legend) const |
| void | rescaleAxes (bool onlyEnlarge=false) const |
| void | rescaleKeyAxis (bool onlyEnlarge=false) const |
| void | rescaleValueAxis (bool onlyEnlarge=false, bool inKeyRange=false) const |
| QCP::SelectionType | selectable () const |
| bool | selected () const |
| QCPDataSelection | selection () const |
| QCPSelectionDecorator * | selectionDecorator () const |
| void | setAntialiasedFill (bool enabled) |
| void | setAntialiasedScatters (bool enabled) |
| void | setBrush (const QBrush &brush) |
| void | setKeyAxis (QCPAxis *axis) |
| void | setName (const QString &name) |
| void | setPen (const QPen &pen) |
| Q_SLOT void | setSelectable (QCP::SelectionType selectable) |
| Q_SLOT void | setSelection (QCPDataSelection selection) |
| void | setSelectionDecorator (QCPSelectionDecorator *decorator) |
| void | setValueAxis (QCPAxis *axis) |
| QCPAxis * | valueAxis () const |
| Public Member Functions inherited from QCPLayerable | |
| QCPLayerable (QCustomPlot *plot, QString targetLayer=QString(), QCPLayerable *parentLayerable=nullptr) | |
| bool | antialiased () const |
| QCPLayer * | layer () const |
| QCPLayerable * | parentLayerable () const |
| QCustomPlot * | parentPlot () const |
| bool | realVisibility () const |
| void | setAntialiased (bool enabled) |
| bool | setLayer (const QString &layerName) |
| Q_SLOT bool | setLayer (QCPLayer *layer) |
| void | setVisible (bool on) |
| bool | visible () const |
| Public Member Functions inherited from QObject | |
| QObject (QObject *parent) | |
| QBindable< QString > | bindableObjectName () |
| bool | blockSignals (bool block) |
| const QObjectList & | children () const const |
| QMetaObject::Connection | connect (const QObject *sender, const char *signal, const char *method, Qt::ConnectionType type) const const |
| void | deleteLater () |
| void | destroyed (QObject *obj) |
| bool | disconnect (const char *signal, const QObject *receiver, const char *method) const const |
| bool | disconnect (const QObject *receiver, const char *method) const const |
| void | dumpObjectInfo () const const |
| void | dumpObjectTree () const const |
| QList< QByteArray > | dynamicPropertyNames () const const |
| virtual bool | event (QEvent *e) |
| virtual bool | eventFilter (QObject *watched, QEvent *event) |
| T | findChild (const QString &name, Qt::FindChildOptions options) const const |
| QList< T > | findChildren (const QRegularExpression &re, Qt::FindChildOptions options) const const |
| QList< T > | findChildren (const QString &name, Qt::FindChildOptions options) const const |
| QList< T > | findChildren (Qt::FindChildOptions options) const const |
| bool | inherits (const char *className) const const |
| void | installEventFilter (QObject *filterObj) |
| bool | isQuickItemType () const const |
| bool | isWidgetType () const const |
| bool | isWindowType () const const |
| void | killTimer (int id) |
| virtual const QMetaObject * | metaObject () const const |
| void | moveToThread (QThread *targetThread) |
| QString | objectName () const const |
| void | objectNameChanged (const QString &objectName) |
| QObject * | parent () const const |
| QVariant | property (const char *name) const const |
| Q_CLASSINFO (Name, Value) | |
| Q_EMIT Q_EMIT | |
| Q_ENUM (...) | |
| Q_ENUM_NS (...) | |
| Q_ENUMS (...) | |
| Q_FLAG (...) | |
| Q_FLAG_NS (...) | |
| Q_FLAGS (...) | |
| Q_GADGET Q_GADGET | |
| Q_GADGET_EXPORT (EXPORT_MACRO) | |
| Q_INTERFACES (...) | |
| Q_INVOKABLE Q_INVOKABLE | |
| Q_MOC_INCLUDE Q_MOC_INCLUDE | |
| Q_NAMESPACE Q_NAMESPACE | |
| Q_NAMESPACE_EXPORT (EXPORT_MACRO) | |
| Q_OBJECT Q_OBJECT | |
| Q_PROPERTY (...) | |
| Q_REVISION Q_REVISION | |
| Q_SET_OBJECT_NAME (Object) | |
| Q_SIGNAL Q_SIGNAL | |
| Q_SIGNALS Q_SIGNALS | |
| Q_SLOT Q_SLOT | |
| Q_SLOTS Q_SLOTS | |
| T | qobject_cast (const QObject *object) |
| T | qobject_cast (QObject *object) |
| QT_NO_NARROWING_CONVERSIONS_IN_CONNECT QT_NO_NARROWING_CONVERSIONS_IN_CONNECT | |
| void | removeEventFilter (QObject *obj) |
| void | setObjectName (const QString &name) |
| void | setObjectName (QAnyStringView name) |
| void | setParent (QObject *parent) |
| bool | setProperty (const char *name, const QVariant &value) |
| bool | setProperty (const char *name, QVariant &&value) |
| bool | signalsBlocked () const const |
| int | startTimer (int interval, Qt::TimerType timerType) |
| int | startTimer (std::chrono::milliseconds interval, Qt::TimerType timerType) |
| QThread * | thread () const const |
Protected Member Functions | |
| virtual void | draw (QCPPainter *painter) override |
| virtual void | drawCurveLine (QCPPainter *painter, const QVector< QPointF > &lines) const |
| virtual void | drawLegendIcon (QCPPainter *painter, const QRectF &rect) const override |
| virtual void | drawScatterPlot (QCPPainter *painter, const QVector< QPointF > &points, const QCPScatterStyle &style) const |
| void | getCurveLines (QVector< QPointF > *lines, const QCPDataRange &dataRange, double penWidth) const |
| QVector< QPointF > | getOptimizedCornerPoints (int prevRegion, int currentRegion, double prevKey, double prevValue, double key, double value, double keyMin, double valueMax, double keyMax, double valueMin) const |
| QPointF | getOptimizedPoint (int otherRegion, double otherKey, double otherValue, double key, double value, double keyMin, double valueMax, double keyMax, double valueMin) const |
| int | getRegion (double key, double value, double keyMin, double valueMax, double keyMax, double valueMin) const |
| void | getScatters (QVector< QPointF > *scatters, const QCPDataRange &dataRange, double scatterWidth) const |
| bool | getTraverse (double prevKey, double prevValue, double key, double value, double keyMin, double valueMax, double keyMax, double valueMin, QPointF &crossA, QPointF &crossB) const |
| void | getTraverseCornerPoints (int prevRegion, int currentRegion, double keyMin, double valueMax, double keyMax, double valueMin, QVector< QPointF > &beforeTraverse, QVector< QPointF > &afterTraverse) const |
| bool | mayTraverse (int prevRegion, int currentRegion) const |
| double | pointDistance (const QPointF &pixelPoint, QCPCurveDataContainer::const_iterator &closestData) const |
| Protected Member Functions inherited from QCPAbstractPlottable1D< QCPCurveData > | |
| void | drawPolyline (QCPPainter *painter, const QVector< QPointF > &lineData) const |
| void | getDataSegments (QList< QCPDataRange > &selectedSegments, QList< QCPDataRange > &unselectedSegments) const |
| Protected Member Functions inherited from QCPAbstractPlottable | |
| void | applyDefaultAntialiasingHint (QCPPainter *painter) const override |
| void | applyFillAntialiasingHint (QCPPainter *painter) const |
| void | applyScattersAntialiasingHint (QCPPainter *painter) const |
| virtual QRect | clipRect () const override |
| virtual void | deselectEvent (bool *selectionStateChanged) override |
| virtual void | selectEvent (QMouseEvent *event, bool additive, const QVariant &details, bool *selectionStateChanged) override |
| virtual QCP::Interaction | selectionCategory () const override |
| Protected Member Functions inherited from QCPLayerable | |
| void | applyAntialiasingHint (QCPPainter *painter, bool localAntialiased, QCP::AntialiasedElement overrideElement) const |
| void | initializeParentPlot (QCustomPlot *parentPlot) |
| virtual void | mouseDoubleClickEvent (QMouseEvent *event, const QVariant &details) |
| virtual void | mouseMoveEvent (QMouseEvent *event, const QPointF &startPos) |
| virtual void | mousePressEvent (QMouseEvent *event, const QVariant &details) |
| virtual void | mouseReleaseEvent (QMouseEvent *event, const QPointF &startPos) |
| bool | moveToLayer (QCPLayer *layer, bool prepend) |
| virtual void | parentPlotInitialized (QCustomPlot *parentPlot) |
| void | setParentLayerable (QCPLayerable *parentLayerable) |
| virtual void | wheelEvent (QWheelEvent *event) |
| Protected Member Functions inherited from QObject | |
| virtual void | childEvent (QChildEvent *event) |
| virtual void | connectNotify (const QMetaMethod &signal) |
| virtual void | customEvent (QEvent *event) |
| virtual void | disconnectNotify (const QMetaMethod &signal) |
| bool | isSignalConnected (const QMetaMethod &signal) const const |
| int | receivers (const char *signal) const const |
| QObject * | sender () const const |
| int | senderSignalIndex () const const |
| virtual void | timerEvent (QTimerEvent *event) |
Protected Attributes | |
| LineStyle | mLineStyle |
| int | mScatterSkip |
| QCPScatterStyle | mScatterStyle |
| Protected Attributes inherited from QCPAbstractPlottable1D< QCPCurveData > | |
| QSharedPointer< QCPDataContainer< QCPCurveData > > | mDataContainer |
| Protected Attributes inherited from QCPAbstractPlottable | |
| bool | mAntialiasedFill |
| bool | mAntialiasedScatters |
| QBrush | mBrush |
| QPointer< QCPAxis > | mKeyAxis |
| QString | mName |
| QPen | mPen |
| QCP::SelectionType | mSelectable |
| QCPDataSelection | mSelection |
| QCPSelectionDecorator * | mSelectionDecorator |
| QPointer< QCPAxis > | mValueAxis |
| Protected Attributes inherited from QCPLayerable | |
| bool | mAntialiased |
| QCPLayer * | mLayer |
| QPointer< QCPLayerable > | mParentLayerable |
| QCustomPlot * | mParentPlot |
| bool | mVisible |
Additional Inherited Members | |
| Properties inherited from QObject | |
| objectName | |
| Signals inherited from QCPAbstractPlottable | |
| void | selectableChanged (QCP::SelectionType selectable) |
| void | selectionChanged (bool selected) |
| void | selectionChanged (const QCPDataSelection &selection) |
| Signals inherited from QCPLayerable | |
| void | layerChanged (QCPLayer *newLayer) |
| Static Public Member Functions inherited from QObject | |
| QMetaObject::Connection | connect (const QObject *sender, const char *signal, const QObject *receiver, const char *method, Qt::ConnectionType type) |
| QMetaObject::Connection | connect (const QObject *sender, const QMetaMethod &signal, const QObject *receiver, const QMetaMethod &method, Qt::ConnectionType type) |
| QMetaObject::Connection | connect (const QObject *sender, PointerToMemberFunction signal, const QObject *context, Functor functor, Qt::ConnectionType type) |
| QMetaObject::Connection | connect (const QObject *sender, PointerToMemberFunction signal, const QObject *receiver, PointerToMemberFunction method, Qt::ConnectionType type) |
| QMetaObject::Connection | connect (const QObject *sender, PointerToMemberFunction signal, Functor functor) |
| bool | disconnect (const QMetaObject::Connection &connection) |
| bool | disconnect (const QObject *sender, const char *signal, const QObject *receiver, const char *method) |
| bool | disconnect (const QObject *sender, const QMetaMethod &signal, const QObject *receiver, const QMetaMethod &method) |
| bool | disconnect (const QObject *sender, PointerToMemberFunction signal, const QObject *receiver, PointerToMemberFunction method) |
| QString | tr (const char *sourceText, const char *disambiguation, int n) |
| Public Attributes inherited from QObject | |
| typedef | QObjectList |
Detailed Description
A plottable representing a parametric curve in a plot.

Unlike QCPGraph, plottables of this type may have multiple points with the same key coordinate, so their visual representation can have loops. This is realized by introducing a third coordinate t, which defines the order of the points described by the other two coordinates x and y.
To plot data, assign it with the setData or addData functions. Alternatively, you can also access and modify the curve's data via the data method, which returns a pointer to the internal QCPCurveDataContainer.
Gaps in the curve can be created by adding data points with NaN as key and value (qQNaN() or std::numeric_limits<double>::quiet_NaN()) in between the two data points that shall be separated.
Changing the appearance
The appearance of the curve is determined by the pen and the brush (setPen, setBrush).
Usage
Like all data representing objects in QCustomPlot, the QCPCurve is a plottable (QCPAbstractPlottable). So the plottable-interface of QCustomPlot applies (QCustomPlot::plottable, QCustomPlot::removePlottable, etc.)
Usually, you first create an instance:
which registers it with the QCustomPlot instance of the passed axes. Note that this QCustomPlot instance takes ownership of the plottable, so do not delete it manually but use QCustomPlot::removePlottable() instead. The newly created plottable can be modified, e.g.:
Definition at line 5634 of file qcustomplot.h.
Member Enumeration Documentation
◆ LineStyle
| enum QCPCurve::LineStyle |
Defines how the curve's line is represented visually in the plot. The line is drawn with the current pen of the curve (setPen).
- See also
- setLineStyle
| Enumerator | |
|---|---|
| lsNone | No line is drawn between data points (e.g. only scatters) |
| lsLine | Data points are connected with a straight line. |
Definition at line 5648 of file qcustomplot.h.
Constructor & Destructor Documentation
◆ QCPCurve()
Constructs a curve which uses keyAxis as its key axis ("x") and valueAxis as its value axis ("y"). keyAxis and valueAxis must reside in the same QCustomPlot instance and not have the same orientation. If either of these restrictions is violated, a corresponding message is printed to the debug output (qDebug), the construction is not aborted, though.
The created QCPCurve is automatically registered with the QCustomPlot instance inferred from keyAxis. This QCustomPlot instance takes ownership of the QCPCurve, so do not delete it manually but use QCustomPlot::removePlottable() instead.
Definition at line 22655 of file qcustomplot.cpp.
◆ ~QCPCurve()
|
overridevirtual |
Definition at line 22669 of file qcustomplot.cpp.
Member Function Documentation
◆ addData() [1/4]
This is an overloaded member function, provided for convenience. It differs from the above function only in what argument(s) it accepts.
Adds the provided points in keys and values to the current data. The provided vectors should have equal length. Else, the number of added points will be the size of the smallest vector.
The t parameter of each data point will be set to the integer index of the respective key/value pair.
Alternatively, you can also access and modify the data directly via the data method, which returns a pointer to the internal data container.
Definition at line 22812 of file qcustomplot.cpp.
◆ addData() [2/4]
| void QCPCurve::addData | ( | const QVector< double > & | t, |
| const QVector< double > & | keys, | ||
| const QVector< double > & | values, | ||
| bool | alreadySorted = false ) |
This is an overloaded member function, provided for convenience. It differs from the above function only in what argument(s) it accepts.
Adds the provided points in t, keys and values to the current data. The provided vectors should have equal length. Else, the number of added points will be the size of the smallest vector.
If you can guarantee that the passed data points are sorted by keys in ascending order, you can set alreadySorted to true, to improve performance by saving a sorting run.
Alternatively, you can also access and modify the data directly via the data method, which returns a pointer to the internal data container.
Definition at line 22780 of file qcustomplot.cpp.
◆ addData() [3/4]
| void QCPCurve::addData | ( | double | key, |
| double | value ) |
This is an overloaded member function, provided for convenience. It differs from the above function only in what argument(s) it accepts.
Adds the provided data point as key and value to the current data.
The t parameter is generated automatically by increments of 1 for each point, starting at the highest t of previously existing data or 0, if the curve data is empty.
Alternatively, you can also access and modify the data directly via the data method, which returns a pointer to the internal data container.
Definition at line 22858 of file qcustomplot.cpp.
◆ addData() [4/4]
| void QCPCurve::addData | ( | double | t, |
| double | key, | ||
| double | value ) |
This is an overloaded member function, provided for convenience. It differs from the above function only in what argument(s) it accepts. Adds the provided data point as t, key and value to the current data.
Alternatively, you can also access and modify the data directly via the data method, which returns a pointer to the internal data container.
Definition at line 22843 of file qcustomplot.cpp.
◆ data()
|
inline |
Returns a shared pointer to the internal data storage of type QCPCurveDataContainer. You may use it to directly manipulate the data, which may be more convenient and faster than using the regular setData or addData methods.
Definition at line 5657 of file qcustomplot.h.
◆ draw()
|
overrideprotectedvirtual |
This function draws the layerable with the specified painter. It is only called by QCustomPlot, if the layerable is visible (setVisible).
Before this function is called, the painter's antialiasing state is set via applyDefaultAntialiasingHint, see the documentation there. Further, the clipping rectangle was set to clipRect.
Implements QCPAbstractPlottable.
Definition at line 22908 of file qcustomplot.cpp.
◆ drawCurveLine()
|
protectedvirtual |
Draws lines between the points in lines, given in pixel coordinates.
- See also
- drawScatterPlot, getCurveLines
Definition at line 23016 of file qcustomplot.cpp.
◆ drawLegendIcon()
|
overrideprotectedvirtual |
called by QCPLegend::draw (via QCPPlottableLegendItem::draw) to create a graphical representation of this plottable inside rect, next to the plottable name.
The passed painter has its cliprect set to rect, so painting outside of rect won't appear outside the legend icon border.
Implements QCPAbstractPlottable.
Definition at line 22976 of file qcustomplot.cpp.
◆ drawScatterPlot()
|
protectedvirtual |
Draws scatter symbols at every point passed in points, given in pixel coordinates. The scatters will be drawn with painter and have the appearance as specified in style.
- See also
- drawCurveLine, getCurveLines
Definition at line 23032 of file qcustomplot.cpp.
◆ getCurveLines()
|
protected |
Called by draw to generate points in pixel coordinates which represent the line of the curve.
Line segments that aren't visible in the current axis rect are handled in an optimized way. They are projected onto a rectangle slightly larger than the visible axis rect and simplified regarding point count. The algorithm makes sure to preserve appearance of lines and fills inside the visible axis rect by generating new temporary points on the outer rect if necessary.
lines will be filled with points in pixel coordinates, that can be drawn with drawCurveLine.
dataRange specifies the beginning and ending data indices that will be taken into account for conversion. In this function, the specified range may exceed the total data bounds without harm: a correspondingly trimmed data range will be used. This takes the burden off the user of this function to check for valid indices in dataRange, e.g. when extending ranges coming from getDataSegments.
penWidth specifies the pen width that will be used to later draw the lines generated by this function. This is needed here to calculate an accordingly wider margin around the axis rect when performing the line optimization.
Methods that are also involved in the algorithm are: getRegion, getOptimizedPoint, getOptimizedCornerPoints mayTraverse, getTraverse, getTraverseCornerPoints.
- See also
- drawCurveLine, drawScatterPlot
Definition at line 23070 of file qcustomplot.cpp.
◆ getKeyRange()
|
overridevirtual |
Returns the coordinate range that all data in this plottable span in the key axis dimension. For logarithmic plots, one can set inSignDomain to either QCP::sdNegative or QCP::sdPositive in order to restrict the returned range to that sign domain. E.g. when only negative range is wanted, set inSignDomain to QCP::sdNegative and all positive points will be ignored for range calculation. For no restriction, just set inSignDomain to QCP::sdBoth (default). foundRange is an output parameter that indicates whether a range could be found or not. If this is false, you shouldn't use the returned range (e.g. no points in data).
Note that foundRange is not the same as QCPRange::validRange, since the range returned by this function may have size zero (e.g. when there is only one data point). In this case foundRange would return true, but the returned range is not a valid range in terms of QCPRange::validRange.
- See also
- rescaleAxes, getValueRange
Implements QCPAbstractPlottable.
Definition at line 22896 of file qcustomplot.cpp.
◆ getOptimizedCornerPoints()
|
protected |
This function is part of the curve optimization algorithm of getCurveLines.
In situations where a single segment skips over multiple regions it might become necessary to add extra points at the corners of region 5 (see getRegion) such that the optimized segment doesn't unintentionally cut through the visible area of the axis rect and create plot artifacts. This method provides these points that must be added, assuming the original segment doesn't start, end, or traverse region 5. (Corner points where region 5 is traversed are calculated by getTraverseCornerPoints.)
For example, consider a segment which directly goes from region 4 to 2 but originally is far out to the top left such that it doesn't cross region 5. Naively optimizing these points by projecting them on the top and left borders of region 5 will create a segment that surely crosses 5, creating a visual artifact in the plot. This method prevents this by providing extra points at the top left corner, making the optimized curve correctly pass from region 4 to 1 to 2 without traversing 5.
Definition at line 23431 of file qcustomplot.cpp.
◆ getOptimizedPoint()
|
protected |
This function is part of the curve optimization algorithm of getCurveLines.
This method is used in case the current segment passes from inside the visible rect (region 5, see getRegion) to any of the outer regions (otherRegion). The current segment is given by the line connecting (key, value) with (otherKey, otherValue).
It returns the intersection point of the segment with the border of region 5.
For this function it doesn't matter whether (key, value) is the point inside region 5 or whether it's (otherKey, otherValue), i.e. whether the segment is coming from region 5 or leaving it. It is important though that otherRegion correctly identifies the other region not equal to 5.
Definition at line 23315 of file qcustomplot.cpp.
◆ getRegion()
|
protected |
This function is part of the curve optimization algorithm of getCurveLines.
It returns the region of the given point (key, value) with respect to a rectangle defined by keyMin, keyMax, valueMin, and valueMax.
The regions are enumerated from top to bottom (valueMin to valueMax) and left to right (keyMin to keyMax):
| 1 | 4 | 7 |
| 2 | 5 | 8 |
| 3 | 6 | 9 |
With the rectangle being region 5, and the outer regions extending infinitely outwards. In the curve optimization algorithm, region 5 is considered to be the visible portion of the plot.
Definition at line 23271 of file qcustomplot.cpp.
◆ getScatters()
|
protected |
Called by draw to generate points in pixel coordinates which represent the scatters of the curve. If a scatter skip is configured (setScatterSkip), the returned points are accordingly sparser.
Scatters that aren't visible in the current axis rect are optimized away.
scatters will be filled with points in pixel coordinates, that can be drawn with drawScatterPlot.
dataRange specifies the beginning and ending data indices that will be taken into account for conversion.
scatterWidth specifies the scatter width that will be used to later draw the scatters at pixel coordinates generated by this function. This is needed here to calculate an accordingly wider margin around the axis rect when performing the data point reduction.
- See also
- draw, drawScatterPlot
Definition at line 23173 of file qcustomplot.cpp.
◆ getTraverse()
|
protected |
This function is part of the curve optimization algorithm of getCurveLines.
This method assumes that the mayTraverse test has returned true, so there is a chance the segment defined by (prevKey, prevValue) and (key, value) goes through the visible region 5.
The return value of this method indicates whether the segment actually traverses region 5 or not.
If the segment traverses 5, the output parameters crossA and crossB indicate the entry and exit points of region 5. They will become the optimized points for that segment.
Definition at line 23698 of file qcustomplot.cpp.
◆ getTraverseCornerPoints()
|
protected |
This function is part of the curve optimization algorithm of getCurveLines.
This method assumes that the getTraverse test has returned true, so the segment definitely traverses the visible region 5 when going from prevRegion to currentRegion.
In certain situations it is not sufficient to merely generate the entry and exit points of the segment into/out of region 5, as getTraverse provides. It may happen that a single segment, in addition to traversing region 5, skips another region outside of region 5, which makes it necessary to add an optimized corner point there (very similar to the job getOptimizedCornerPoints does for segments that are completely in outside regions and don't traverse 5).
As an example, consider a segment going from region 1 to region 6, traversing the lower left corner of region 5. In this configuration, the segment additionally crosses the border between region 1 and 2 before entering region 5. This makes it necessary to add an additional point in the top left corner, before adding the optimized traverse points. So in this case, the output parameter beforeTraverse will contain the top left corner point, and afterTraverse will be empty.
In some cases, such as when going from region 1 to 9, it may even be necessary to add additional corner points before and after the traverse. Then both beforeTraverse and afterTraverse return the respective corner points.
Definition at line 23811 of file qcustomplot.cpp.
◆ getValueRange()
|
overridevirtual |
Returns the coordinate range that the data points in the specified key range (inKeyRange) span in the value axis dimension. For logarithmic plots, one can set inSignDomain to either QCP::sdNegative or QCP::sdPositive in order to restrict the returned range to that sign domain. E.g. when only negative range is wanted, set inSignDomain to QCP::sdNegative and all positive points will be ignored for range calculation. For no restriction, just set inSignDomain to QCP::sdBoth (default). foundRange is an output parameter that indicates whether a range could be found or not. If this is false, you shouldn't use the returned range (e.g. no points in data).
If inKeyRange has both lower and upper bound set to zero (is equal to QCPRange()), all data points are considered, without any restriction on the keys.
Note that foundRange is not the same as QCPRange::validRange, since the range returned by this function may have size zero (e.g. when there is only one data point). In this case foundRange would return true, but the returned range is not a valid range in terms of QCPRange::validRange.
- See also
- rescaleAxes, getKeyRange
Implements QCPAbstractPlottable.
Definition at line 22902 of file qcustomplot.cpp.
◆ lineStyle()
|
inline |
Definition at line 5660 of file qcustomplot.h.
◆ mayTraverse()
|
protected |
This function is part of the curve optimization algorithm of getCurveLines.
This method returns whether a segment going from prevRegion to currentRegion (see getRegion) may traverse the visible region 5. This function assumes that neither prevRegion nor currentRegion is 5 itself.
If this method returns false, the segment for sure doesn't pass region 5. If it returns true, the segment may or may not pass region 5 and a more fine-grained calculation must be used (getTraverse).
Definition at line 23595 of file qcustomplot.cpp.
◆ pointDistance()
|
protected |
Calculates the (minimum) distance (in pixels) the curve's representation has from the given pixelPoint in pixels. This is used to determine whether the curve was clicked or not, e.g. in selectTest. The closest data point to pixelPoint is returned in closestData. Note that if the curve has a line representation, the returned distance may be smaller than the distance to the closestData point, since the distance to the curve line is also taken into account.
If either the curve has no data or if the line style is lsNone and the scatter style's shape is QCPScatterStyle::ssNone (i.e. there is no visual representation of the curve), returns -1.0.
Definition at line 23907 of file qcustomplot.cpp.
◆ scatterSkip()
|
inline |
Definition at line 5659 of file qcustomplot.h.
◆ scatterStyle()
|
inline |
Definition at line 5658 of file qcustomplot.h.
◆ selectTest()
|
overridevirtual |
Implements a selectTest specific to this plottable's point geometry.
If details is not 0, it will be set to a QCPDataSelection, describing the closest data point to pos.
\seebaseclassmethod QCPAbstractPlottable::selectTest
Reimplemented from QCPAbstractPlottable1D< QCPCurveData >.
Definition at line 22874 of file qcustomplot.cpp.
◆ setData() [1/3]
This is an overloaded member function, provided for convenience. It differs from the above function only in what argument(s) it accepts.
Replaces the current data with the provided points in keys and values. The provided vectors should have equal length. Else, the number of added points will be the size of the smallest vector.
The t parameter of each data point will be set to the integer index of the respective key/value pair.
- See also
- addData
Definition at line 22722 of file qcustomplot.cpp.
◆ setData() [2/3]
| void QCPCurve::setData | ( | const QVector< double > & | t, |
| const QVector< double > & | keys, | ||
| const QVector< double > & | values, | ||
| bool | alreadySorted = false ) |
This is an overloaded member function, provided for convenience. It differs from the above function only in what argument(s) it accepts.
Replaces the current data with the provided points in t, keys and values. The provided vectors should have equal length. Else, the number of added points will be the size of the smallest vector.
If you can guarantee that the passed data points are sorted by t in ascending order, you can set alreadySorted to true, to improve performance by saving a sorting run.
- See also
- addData
Definition at line 22704 of file qcustomplot.cpp.
◆ setData() [3/3]
| void QCPCurve::setData | ( | QSharedPointer< QCPCurveDataContainer > | data | ) |
This is an overloaded member function, provided for convenience. It differs from the above function only in what argument(s) it accepts.
Replaces the current data container with the provided data container.
Since a QSharedPointer is used, multiple QCPCurves may share the same data container safely. Modifying the data in the container will then affect all curves that share the container. Sharing can be achieved by simply exchanging the data containers wrapped in shared pointers:
If you do not wish to share containers, but create a copy from an existing container, rather use the QCPDataContainer<DataType>::set method on the curve's data container directly:
- See also
- addData
Definition at line 22688 of file qcustomplot.cpp.
◆ setLineStyle()
| void QCPCurve::setLineStyle | ( | QCPCurve::LineStyle | style | ) |
Sets how the single data points are connected in the plot or how they are represented visually apart from the scatter symbol. For scatter-only plots, set style to lsNone and setScatterStyle to the desired scatter style.
- See also
- setScatterStyle
Definition at line 22763 of file qcustomplot.cpp.
◆ setScatterSkip()
| void QCPCurve::setScatterSkip | ( | int | skip | ) |
If scatters are displayed (scatter style not QCPScatterStyle::ssNone), skip number of scatter points are skipped/not drawn after every drawn scatter point.
This can be used to make the data appear sparser while for example still having a smooth line, and to improve performance for very high density plots.
If skip is set to 0 (default), all scatter points are drawn.
- See also
- setScatterStyle
Definition at line 22751 of file qcustomplot.cpp.
◆ setScatterStyle()
| void QCPCurve::setScatterStyle | ( | const QCPScatterStyle & | style | ) |
Sets the visual appearance of single data points in the plot. If set to QCPScatterStyle::ssNone, no scatter points are drawn (e.g. for line-only plots with appropriate line style).
- See also
- QCPScatterStyle, setLineStyle
Definition at line 22735 of file qcustomplot.cpp.
Member Data Documentation
◆ mLineStyle
|
protected |
Definition at line 5685 of file qcustomplot.h.
◆ mScatterSkip
|
protected |
Definition at line 5684 of file qcustomplot.h.
◆ mScatterStyle
|
protected |
Definition at line 5683 of file qcustomplot.h.
The documentation for this class was generated from the following files:
Documentation copyright © 1996-2025 The KDE developers.
Generated on Fri May 2 2025 12:02:40 by doxygen 1.13.2 written by Dimitri van Heesch, © 1997-2006
KDE's Doxygen guidelines are available online.